
(updated August 29, 2001)
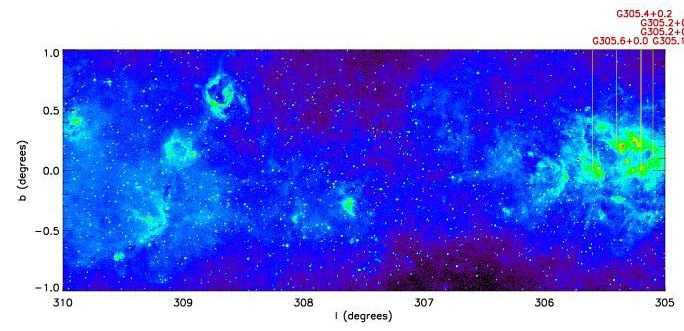
Maps of each 5 deg section showing diffuse & point source flux to approximately half full-well (displaying to peak flux of 30mJy)(24 images in all)
First row= number of MSX point sources in each 5 degree long strip
Second row= Number of point sources that exceed 300 mJy
Third row= Number of pixels that exceed the diffuse flux limit of
           Log10(Watts/ m^2/sr) > 10^-3.51
Third row= Number of pixels that exceed a diffuse flux limit of
           Log10(Watts/ m^2/sr) > 10^-4.51
Fifth row= 100*Percentage of saturated pixels  (NOTE!! 1.0 means 0.01%)
Sixth row= Same as above (NOTE!! 10.0 means 0.1%)

Lmin=                              10     15   20     25    30   35     40    45    50    55    60    65
Total MSX point sources           3200  3296  3285  3262  3193  2933  2836  2669  2318  2060  1804  1582
Saturated MSX point sources       2173  2350  2254  2313  1821  1330  1131  1059   874   705   572   493
Saturated MSX pixels               133  1108    66   183    69    36   157    79    23     5    20    47
Saturated MSX pixels (10x faint)  8217 16517  4323  5755  5368  1422  2032  4347  1163   911  1296   693
100*Percent of total pixels      0.368 3.066 0.183 0.506 0.191 0.100 0.434 0.219 0.064 0.014 0.055 0.130
100*Percent of total pixels (10x) 22.7  45.6  11.9  15.9  14.8   3.9   5.6  12.0   3.2   2.5   3.5   1.9


Lmin=                              350    345    340    335    330    325    320    315    310    305    300    295
Total MSX point sources	          3082   2950   3235   2951   3053   2852   2675   2774   2709   2182   2002   1811
Saturated MSX point source	  1822   1643   2127   1904   1623   1386   1191   1217   1282    901    740    645
Saturated MSX pixels               271    162    195    190    170     60     83     90    170      5     35    277
Saturated MSX pixels at 10x       6043   3665   5076  13318   6109   2821   2620   1797   5608   1471   1387   5732
100*Percent of total pixels      0.750  0.448  0.540  0.526  0.471  0.166  0.230  0.249  0.471  0.014  0.097  0.766
100*Percent of total pixels(10x)  16.7   10.1   14.1   36.8   16.9    7.8    7.3    5.0   15.5    4.1    3.8   15.9