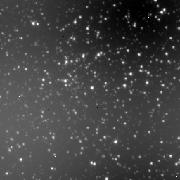
The 148x148 simulated PSF images were copied into section of a larger 512x512 image. Stellar positions were randomly selected from a probability distribution of the form N(r) proportional to r^{1-a}. We chose a=1/2 for bands 1,3 and a=1 for bands 2,4 (a=0 is a uniform distribution). Thus bands 2 & 4 have a more compact clustering of stars. To simulate different fluxes at different wavelengths, we randomly selected temperatures for the stars from the distribution N(t) proportional to T^{-4} with a range of 500-4000K. This produced mostly blue stars, so we added a distribution of cold luminous sources with N(T) = 15-165 K. These made up 25% of the sources. We also went crazy and added in reddening, with Av proportional to r^-{1/4} but left the value small for these images. We continued our craziness and added a fraction of unreddened (foreground) stars. The 512x512 images are shown here. A fits header was added to these. The image for bands 1&3 contains 13621 stars, the image for bands 2&4 contains 19395 stars. The extracted 256x256 images contain at least 3000 stars. The IDL routines hrot and hextract updated the headers with proper coordinate information in the extract images. A sample fits header is shown here.
Next we added background. To make it look slightly realistic, we used a functional form, F=a(cos(x/b)+c(sin(y/d)+e and varied the constants a,c,e for each field. This link shows the effect of adding background to our image. It is significant. We guessed a range of 100-400 counts out of 4096 (we are assuming 4096 is saturation based on HST images). We need to determine a better idea of what the expected background levels will be for our photometry tests.
We modified the calibrated image by adding bad pixels, cosmic rays, and added noise to channel 3 & 4 images to see if we can find it in our Level B processes) for all pixels in the image (randomly selected from a gaussian distribution with a standard deviation of 1 count).
This data set has been shifted (delx=5 pix, dely=10 pix) and rotated (by 10 degrees) to mimic an IRAC revisit of one of our fields.