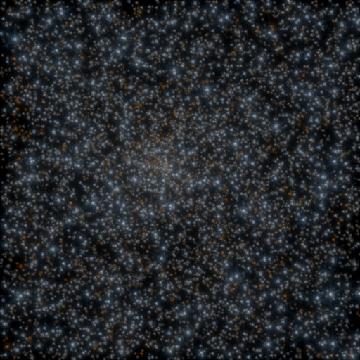
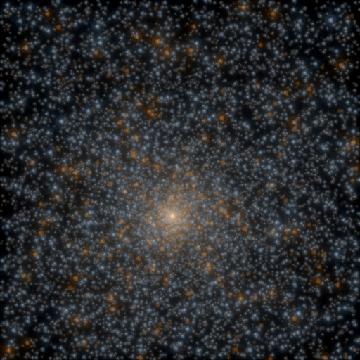
These are the 512x512 images from which the simulated IRAC images are extracted. On the left is a "true-color" representation of bands 1 & 3. In a true-color image, three images are displayed at once each with a different color: blue, green or red. In this figure Band 1 is blue, the average of Bands 1 & 3 is green, and Band 3 is red. The image on the right is a true-color representation of bands 2 & 4 with band 2 in blue, the average of the two bands in green, and band 4 in red. As described here, the stellar spectra are assumed to be Planck functions. 75% of the stars have temperatures in the range 500-4000K and due to the lack of sophistication in the simulation, these are weighted to the higher-temperature sources because they are brighter so they mostly show up blue in these images. 25% of the stars are luminous and cold with a T=15-165K. These show up as the red stars in band 4. Note that these images have no noise or background added to them.
|
|
|
|
|
|