- Team logo [ jpeg ]
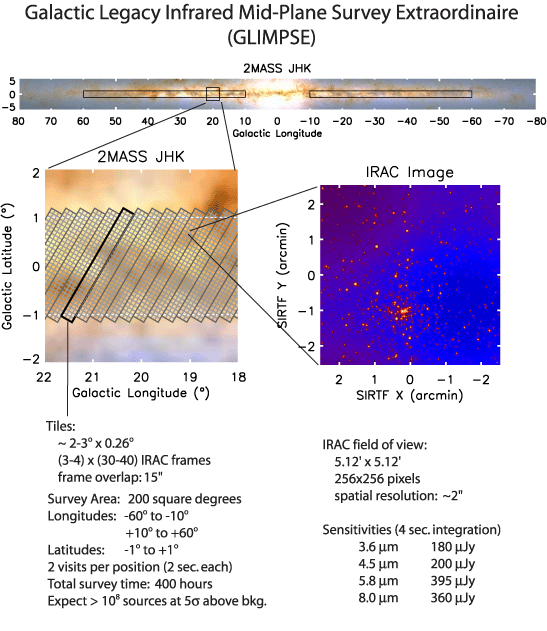
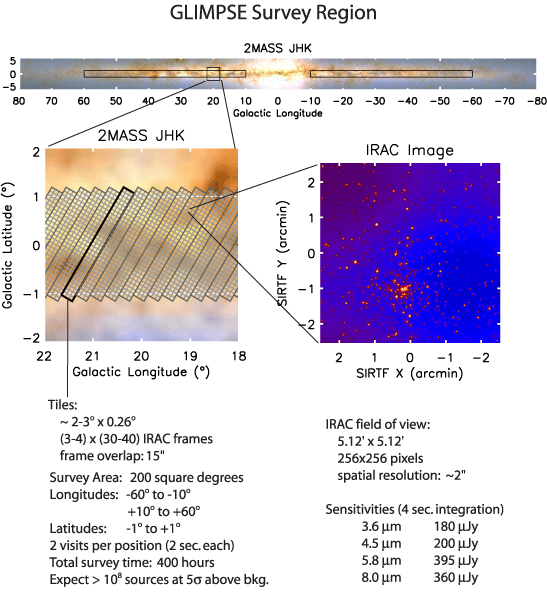
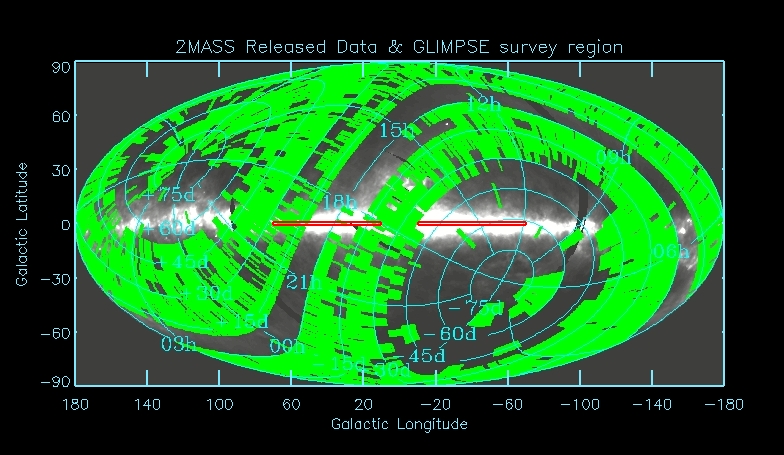
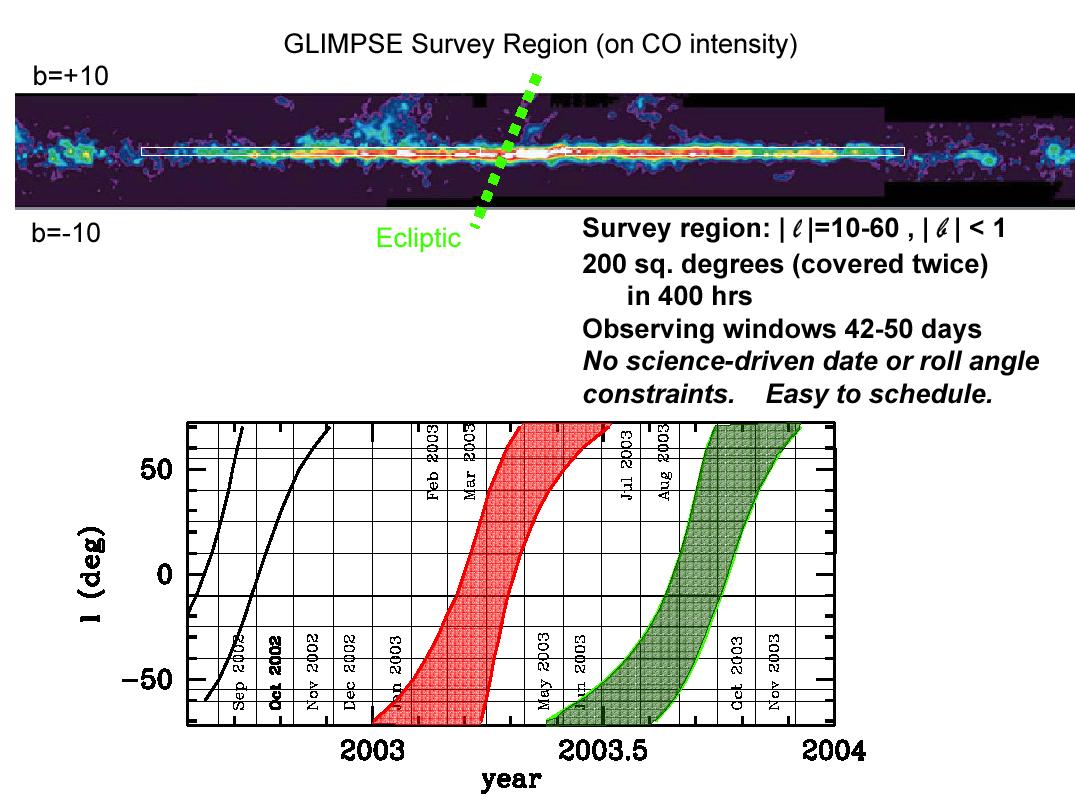
- 2MASS Released Data & GLIMPSE Survey Region [jpg ]
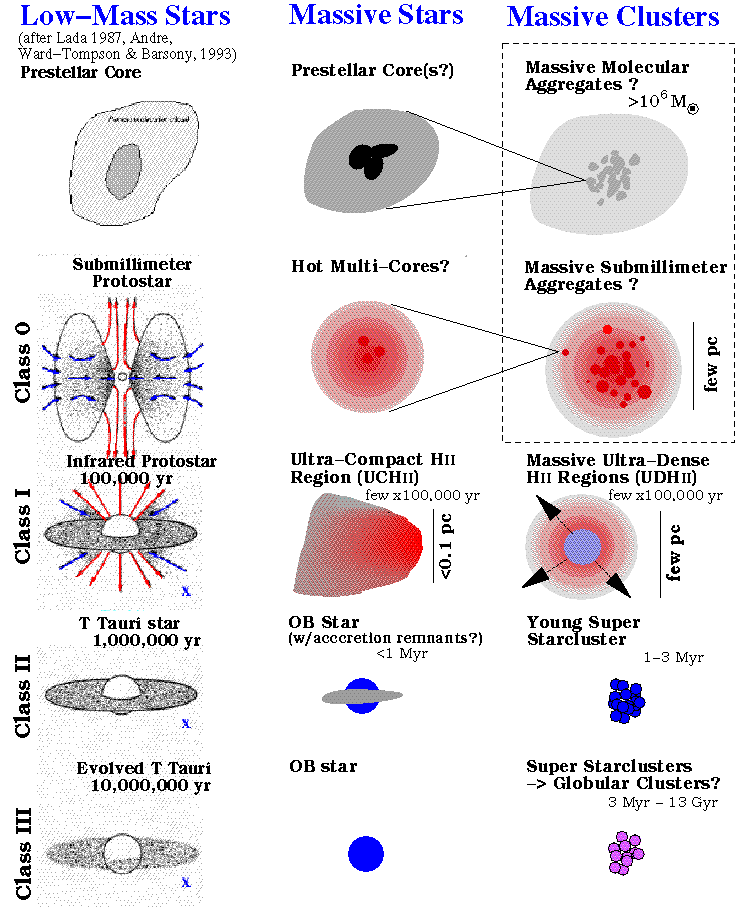
- Schematic illustrating the stages of low-mass, massive, and clustered star formation as a science driver for our SIRTF program (Credit: Kobulnicky & Johnson 2000) [ gif ] [ ps ]
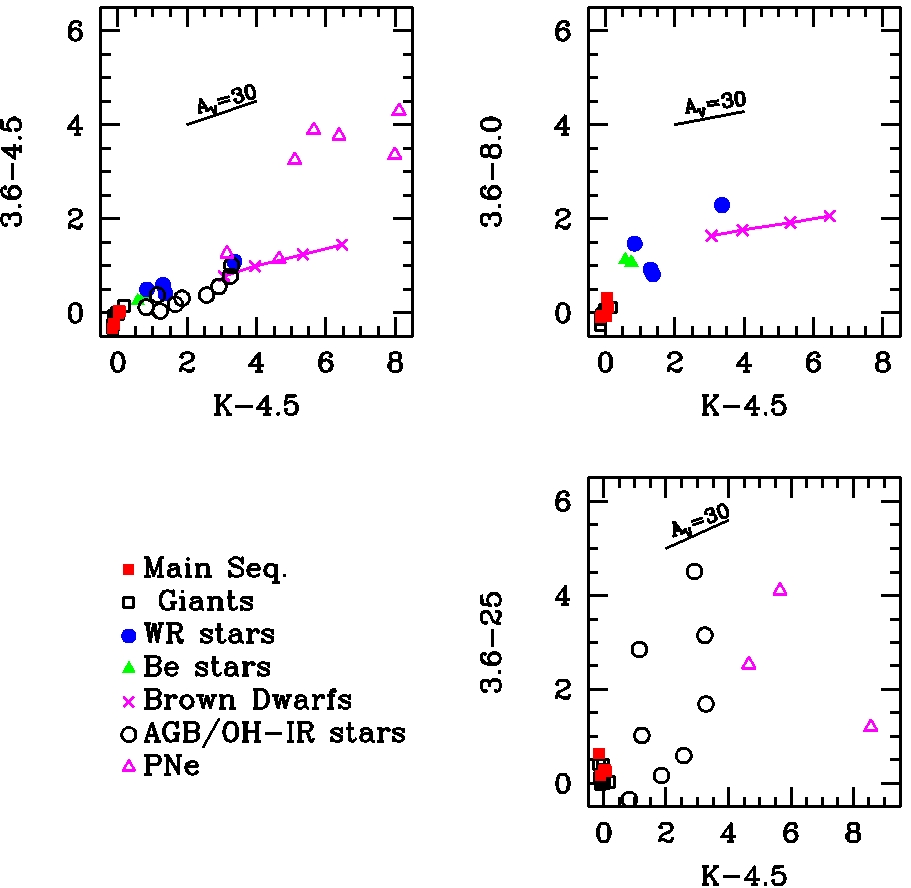

- Composite near-infrared intensity observed by the Diffuse Infrared Background Experiment (DIRBE) instrument on the Cosmic Background Explorer (COBE) in the 1.25, 2.2, and 3.5 micron wavelength bands. The images are encoded in the blue, green, and red color ranges, respectively. (credit Hauser, M. G., Kelsall, T., Leisawitz, D., & Weiland, J. 1995, COBE Diffuse Infrared Background Experiment Explanatory Supplement, Version 2.0, COBE Ref. Pub. No. 95-A (Greenbelt, MD: NASA/GSFC) ) [ gif ] [ ps ]
- Overview of observing strategy presented at Feb 2-3 Madison workshop by Chip. 8 color pages [ StarImpress (PowerPoint compatible?) ] [ ps ]
- Large 4x5 foot poster of the GLIMPSE survey region based on MSX 8 micron data [ gzipped ps ]
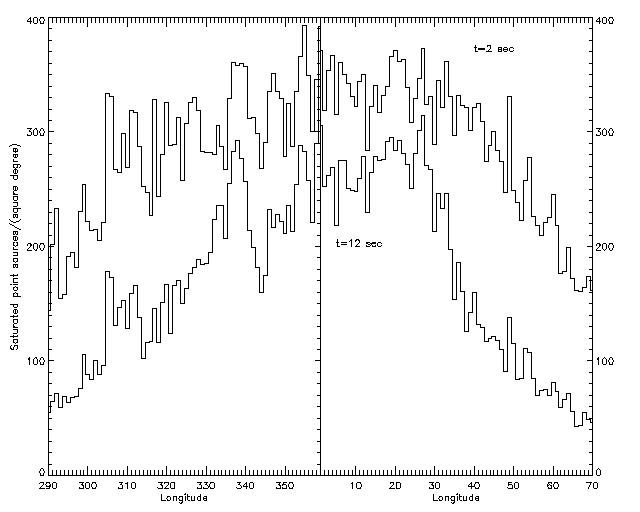
- Histogram of number of saturated point sources as a function of galactic longitude based on MSX 8 micron point source catalog. (Figure produced by Bob Benjamin) data [ gif ]
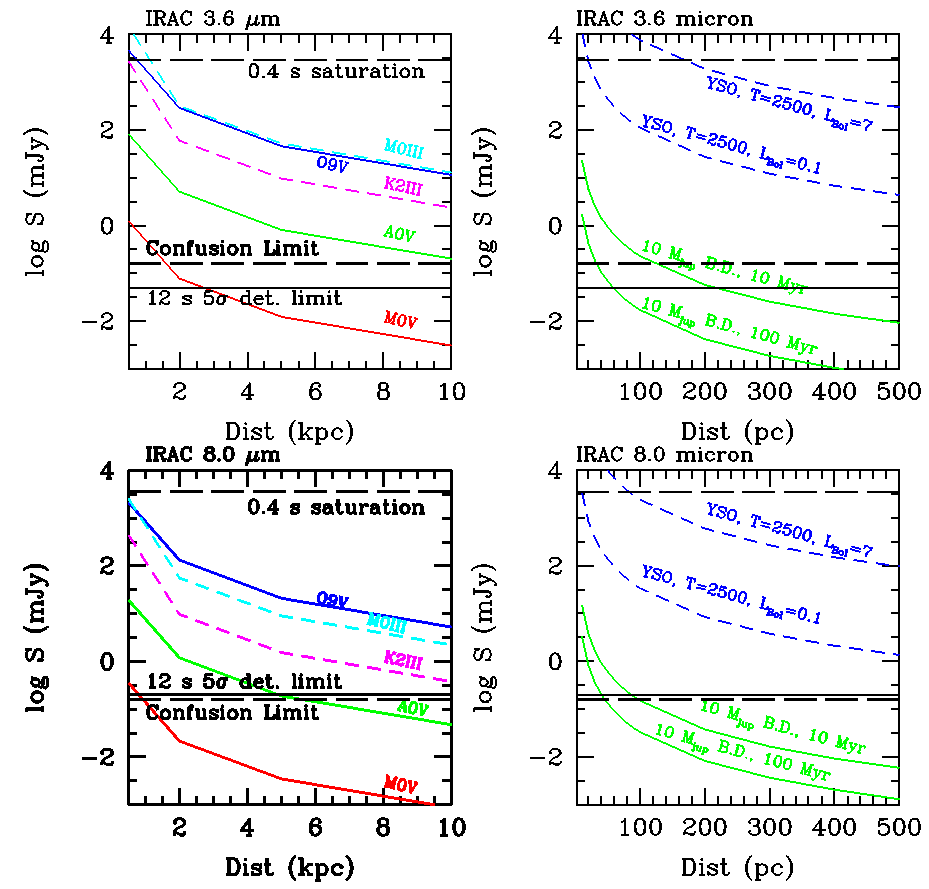
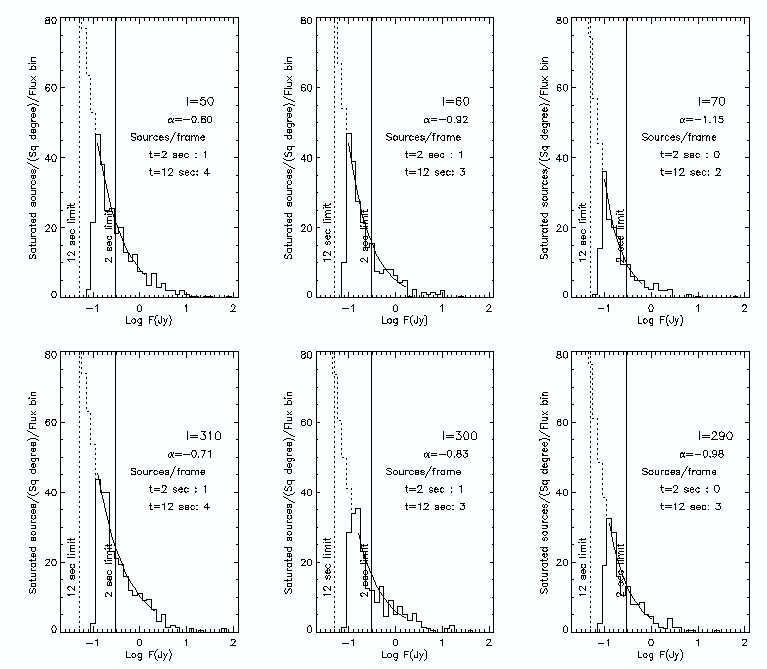
- Another histogram just showing saturation at inner longitudes, with source counts extrapolated to fainter magnitudes. This figure is a good argument for doing 2 sec rather than 12 sec exposures. With 2 sec exposures, only 2-3 sources will saturate per IRAC field, even in the inner parts of the Plane. data [ gif ]
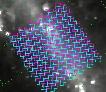
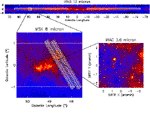
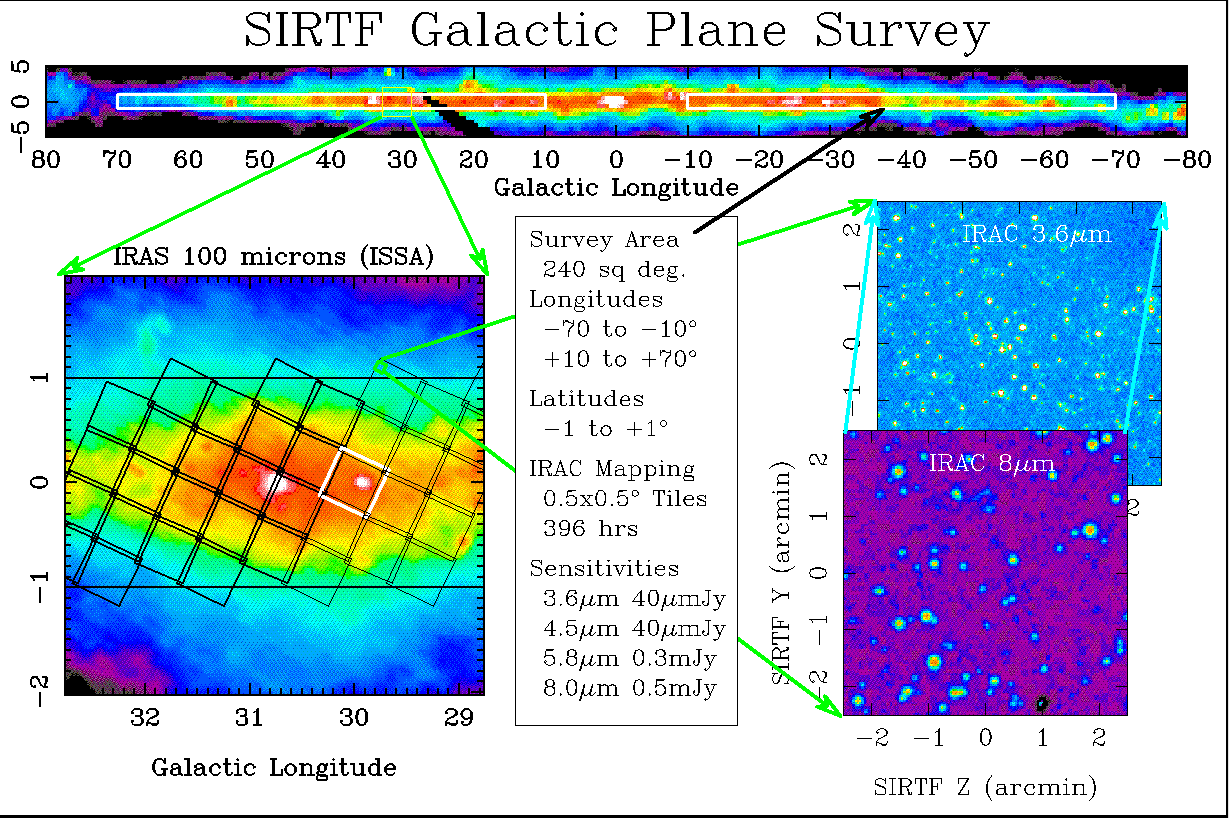
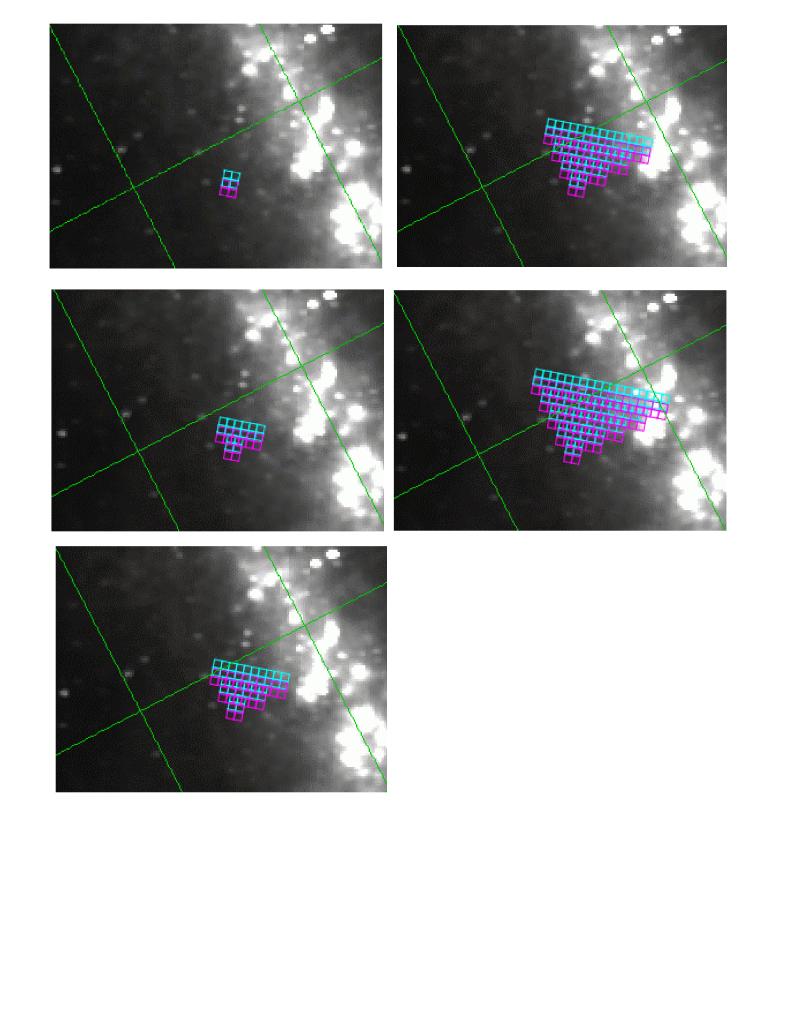
- Schematics of the IRAC mapping of the Galactic Plane data
- [ Explanatory text (2001Apr05) ]
- [ sample segment interface (close-up)]
- [ sample segment interface]
- [ sample segment interface (wide-angle) ]
- [ multi-AOR image ]
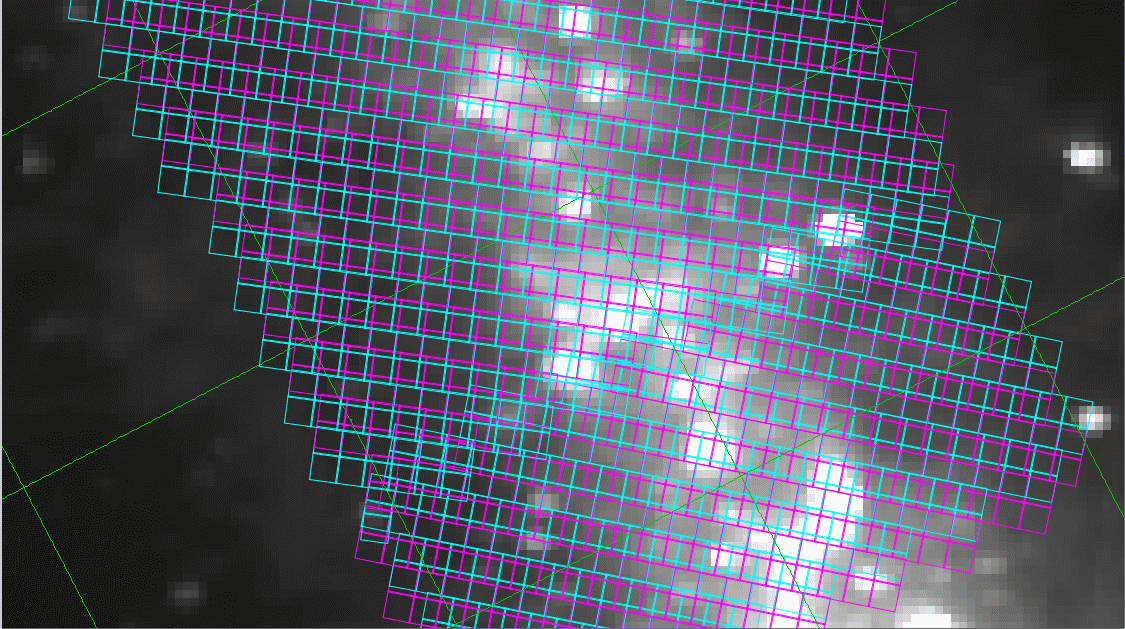
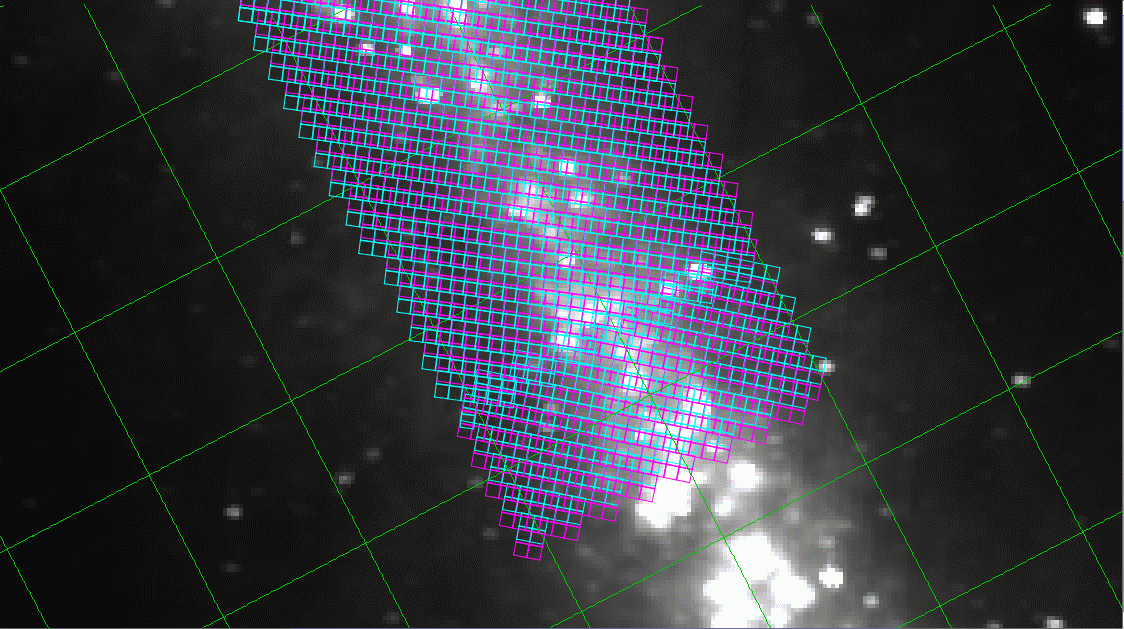
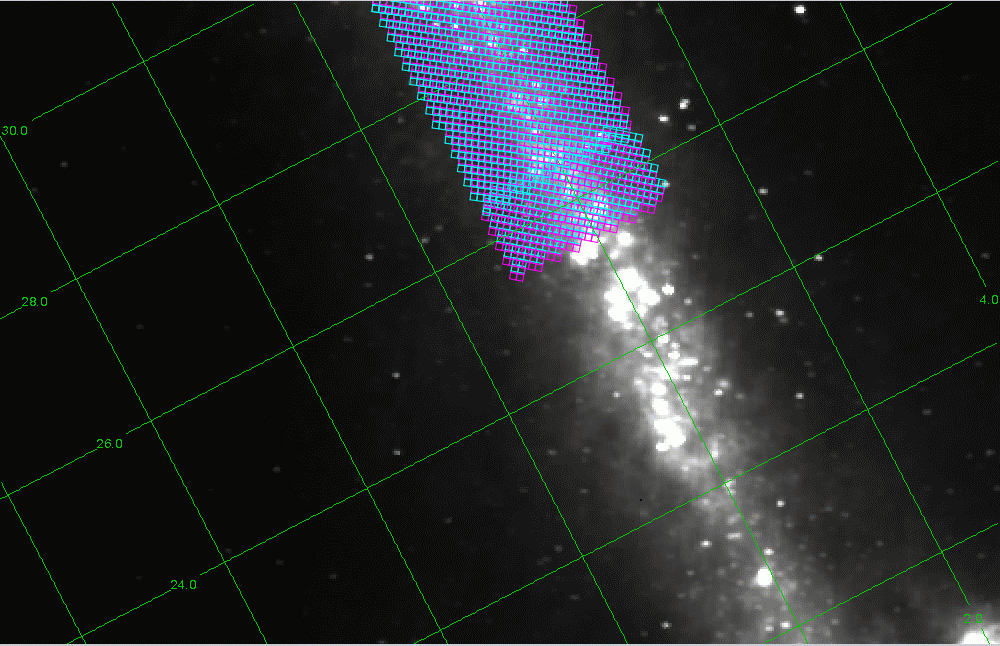
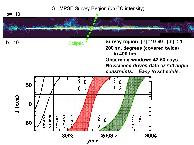
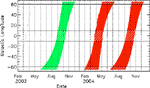
- Windows for GLIMPSE Observations data
- [ Observing windows (2001Oct6) ]
or [ PDF ]
(Click here to download a free copy of Acrobat Reader, to read .pdf files)