

Skip to: channel 1 channel 2 channel 3 channel 4 summary plots of first frame offsets
Under bright illumination, such as the TCAL, there is a similar effect, usually of opposite sign from the dark case, and far too large to be explained by invoking latent images (image persistence). The first frame effect, and for that matter, dark images in general, depend on the frame time and Fowler number. It is expected that during the SIRTF mission, dark frames for calibration will be obtained for every combination of frame times and Fowler number that are used in science AOTs. The variation of dark frames complicates the data reduction, because for each image in an AOT, the dark image that is subtracted will have to be generated from a calibration sequence carefully constructed to match, or it will have to be computed from a library of darks. Finally, I emphasize that the dark variations are NOT RANDOM -- they depend on the time between images and the previous images themselves.
The first systematic test of the first frame effect was carried out at BASC on 2001 April 20 and 21 with the B-side electronics, through TTACS, and with IRAC operating under typical conditions with SFHe. The test ran for the first two hours of a planned three-hour test. It stopped most of the way through the procedure, when it encountered an error in the IER that attempted to take pedestal-signal frames with NUMREPEATS > 1. All the really useful frames had already been taken. In total, 751 data frames are generated by this test. There are no abnormal images, and all frames that were expected were recorded.
The results show that the first frame effect depends mostly on the time between the beginning of a frame and the end of the previous frame in the same channel. The dependence is very strong in channel 3, which has the largest first frame effect. It is weakest in channel 2, which has the weakest first frame effect. The strength of the dependence of the first frame effect on the delay depends on the frame time and Fowler number; this is expected, because the strength of the first frame effect also depends on these parameters. The test was primarily designed to measure the effect due to delay time, since there appeared to be a strong correlation with it in previous tests of latents and darks. There probably is also a dependence on the mean of the previous image. It appears that there is little or no direct dependence on the frametime or the Fowler number of the previous frames; observed changes occur because of the time delay induced by changing the frametime or Fowler number, and because the mean of a frame depends on the frametime and Fowler number. In the entire test, I notice only one big anomaly. It occurred in channel 3 at the beginning of the 100sF16 data set, which followed the 12sF8 data set by a 1 s delay, which is the time the IER schedules to execute a DOIT command. It is discussed in the section on channel 3. There are smaller but significant anomalies in the frames taken at the same time in channels 1 and 4.
The entire test was carried out with dark frames, with the shutter closed and after all latents had decayed away. Further tests need to be done to measure the first frame effect as a function of illumination and its dependence, if any, on the state of the arrays at the end of the previous frame. To calibrate science data, tests need to be carried out with all the standard combinations of frametime and Fowler number, as well as the high dynamic range modes.
IER to characterize first-frame effect

Objective: To characterize the first frame effect in order to be able
to develop a model so we can correct for it in flight data. This will
be the first systematic measurement of the first frame effect. Such a
characterization is also needed to remove the uncorrected first frame
effect from the latent test data. This test does not measure the
illuminated first frame effect, which usually has the opposite sign,
for sufficiently bright sources. That test must be carried out at a
later time when we have a better idea of what to look for.

Method:  Sequences of darks are taken in Fowler and Pedestal-Signal mode at a
small subset of the standard frametime-Fowler number combinations. A smaller set
of frames is taken with Fowler number=1 to get a clear measurement of the first
pedestal value. The time between frames or sets of frames ranges from the minimum
to various values appropriate for science observations and the latent tests.
The strength of the first frame effect depends on channel, the frame
time and fowler number, and the time since the end of the previous data
frame. There may be other dependencies, but they are not at all obvious.
In channel 3 the error in dark subtraction can be as large as hundreds of
electrons. Channel 2 has the weakest effect; the error is typically less than
8 electrons. Channels 1 and 4 are intermediate in strength.

Total test time needed: 3h 4m as written [it ran 2 hours before aborting]

Initial condition: IRAC has been on for long enough for the warm electronics
to stabilize (>1 or 2 hours). This test is insensitive to latents from a reasonable
illumination prior to the beginning of the test.

begin test
shutter closed

verify initial state and reasonable lack of latents:
3x(100sf16) (ch4: 6x50sf16)

channel 1 ONLY: (all arrays powered, use GO or NOGO)
  This tests effects on images and delays too short to
   be measured with all 4 channels simultaneously. Needed
    to correct results of short latents in latent test.

10x{
no delay
DOIT: 2sf4
}
5x{
2s delay
DOIT: 2sf4
}
3x{
4s delay
DOIT: 2sf4
}
3x{
10s delay
DOIT: 2sf4
}
3x{
30s delay
DOIT: 2sf4
}
3x{
100s delay
DOIT: 2sf4
}

  To save time, don't repeat the above for channels 2,3 or 4.

all 4 channels:
 Take 12s Fowler 1's and pedestal-sigal frames to get clearer picture of
  what's happening

DOIT: 10x12sf1
no delay
DOIT: 5x12sf1
no delay
DOIT: 5x12sf1
2s delay
DOIT: 5x12sf1
2s delay
DOIT: 5x12sf1
10s delay
DOIT: 5x12sf1
10s delay
DOIT: 5x12sf1
30s delay
DOIT: 5x12sf1
30s delay
DOIT: 5x12sf1
100s delay
DOIT: 5x12sf1
100s delay
DOIT: 5x12sf1
4s delay

DOIT: 1x12ssp1
4s delay
DOIT: 1x12ssp1
4s delay
DOIT: 1x12ssp1
10s delay
DOIT: 1x12ssp1
10s delay
DOIT: 1x12ssp1
30s delay
DOIT: 1x12ssp1
30s delay
DOIT: 1x12ssp1
100s delay
DOIT: 1x12ssp1
100s delay
DOIT: 1x12ssp1

 Now 12s Fowler 8's

DOIT: 10x12sf8
no delay
DOIT: 5x12sf8
no delay
DOIT: 5x12sf8
2s delay
DOIT: 5x12sf8
2s delay
DOIT: 5x12sf8
10s delay
DOIT: 5x12sf8
10s delay
DOIT: 5x12sf8
30s delay
DOIT: 5x12sf8
30s delay
DOIT: 5x12sf8
100s delay
DOIT: 5x12sf8
100s delay
DOIT: 5x12sf8
no delay

 Now a long frame time with the standard fowler number

DOIT: 5x100sf16 (ch4: 10x50sf16)
no delay
DOIT: 3x100sf16 (ch4: 6x50sf16)
no delay
DOIT: 3x100sf16 (ch4: 6x50sf16)
2s delay
DOIT: 3x100sf16 (ch4: 6x50sf16)
2s delay
DOIT: 3x100sf16 (ch4: 6x50sf16)
10s delay
DOIT: 3x100sf16 (ch4: 6x50sf16)
10s delay
DOIT: 3x100sf16 (ch4: 6x50sf16)
30s delay
DOIT: 3x100sf16 (ch4: 6x50sf16)
30s delay
DOIT: 3x100sf16 (ch4: 6x50sf16)
100s delay
DOIT: 3x100sf16 (ch4: 6x50sf16)
100s delay
DOIT: 3x100sf16 (ch4: 6x50sf16)

 Now pedestal-signal frames with fowler 1 to look at pedestal

[The procedure aborted on the first set of images in the first
  DOIT, wothout saving the images, because it attempted to
    take the second set of pedestals while before the buffers
      had finished being read out.]
DOIT: 5x100sps1 (ch4: 10x50sps1)
no delay
DOIT: 3x100sps1 (ch4: 6x50sps1)
no delay
DOIT: 3x100sps1 (ch4: 6x50sps1)
2s delay
DOIT: 3x100sps1 (ch4: 6x50sps1)
2s delay
DOIT: 3x100sps1 (ch4: 6x50sps1)
10s delay
DOIT: 3x100sps1 (ch4: 6x50sps1)
10s delay
DOIT: 3x100sps1 (ch4: 6x50sps1)
30s delay
DOIT: 3x100sps1 (ch4: 6x50sps1)
30s delay
DOIT: 3x100sps1 (ch4: 6x50sps1)
100s delay
DOIT: 3x100sps1 (ch4: 6x50sps1)
100s delay
DOIT: 3x100sps1 (ch4: 6x50sps1)

end test
Summary tables of parameters and results from each frame, including the mean value of the
image and the delay times, are in the following ASCII files. The first is a time-ordered
sequence for all channels and the rest are for a single channel.
first_frame_summary.txt
first_frame_summary_ch1.txt
first_frame_summary_ch2.txt
first_frame_summary_ch3.txt
first_frame_summary_ch4.txt
In this section I describe the results of each channel separately. The effect is the largest in channel 3, followed by channel 1, then 4, and finally channel 2, where it is probably negligible for most science programs. Channel 2 behaves like a typical InSb array from the lots with the same multiplexer and detector material. Channel 1 was very similar to channel 2, with regard to Fowler bias, until the beginning of the last cold cycle of tests at GSFC in 1999. When IRAC was assembled for the last time, just before that cold cycle, it appears that one of the the bias lines for channel 1, that supplies current to the Vddcl pin on the mux, did not connect somewhere inside the dewar. Pipher and Forrest were able to duplicate the behavior at UR in a sister array by removing the Vddcl connection. After this cold cycle, IRAC was installed in the MIC at BASC. Since cold testing began at BASC in Dec 1999, this electrical connection has been open. It was not possible to diagnose this problem at BASC operating IRAC warm. With the open connection, the clamps in the mux fail to operate properly, and during short intervals when no row is addressed, the current into each unit cell source-follower debiases the detectors. Other than the extra time needed to calibrate the dark variations, there is no deleterious effect on the performance of channel 1; in particular, there was no increase in noise from before to after the Vddcl line opened up.
Channel 3 and 4 are typical of the Si:As arrays from their lots. In general, the IBC arrays have had larger first frame effects than the InSb arrays. It is thought that this is primarily due to the colder operating point, closer to freezeout, where the Si muxes require a long time for the charge distribution to reach equilibrium.
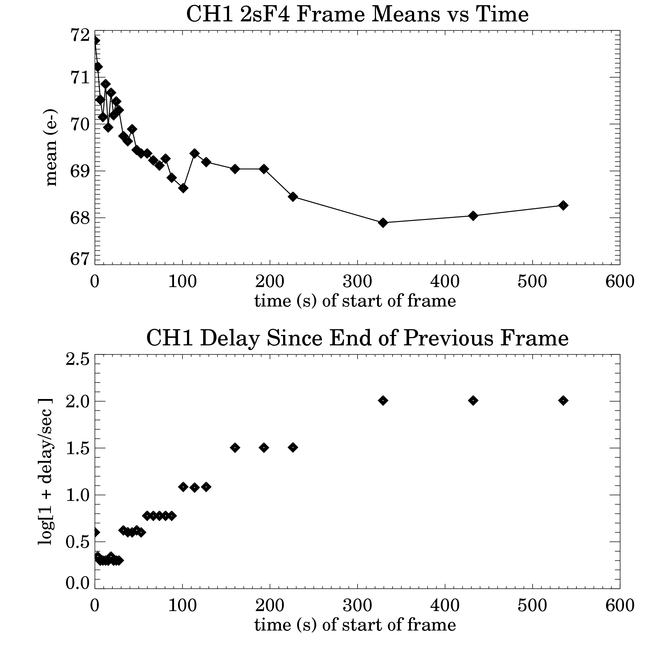
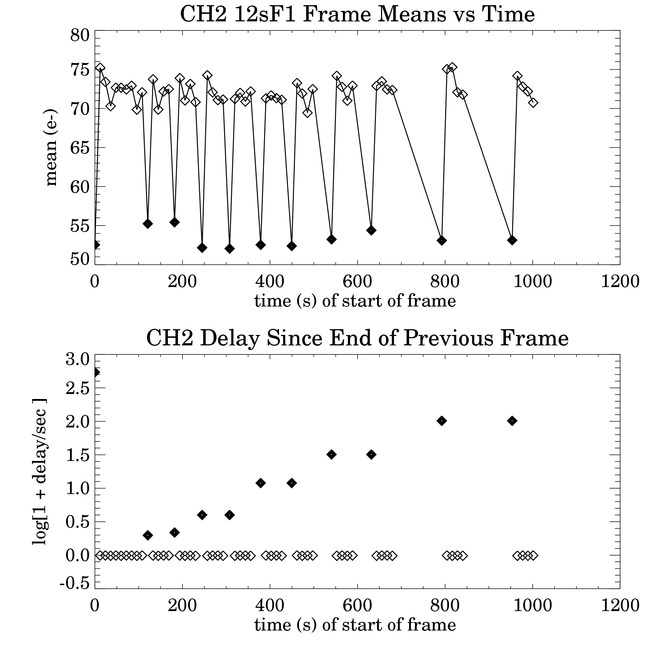
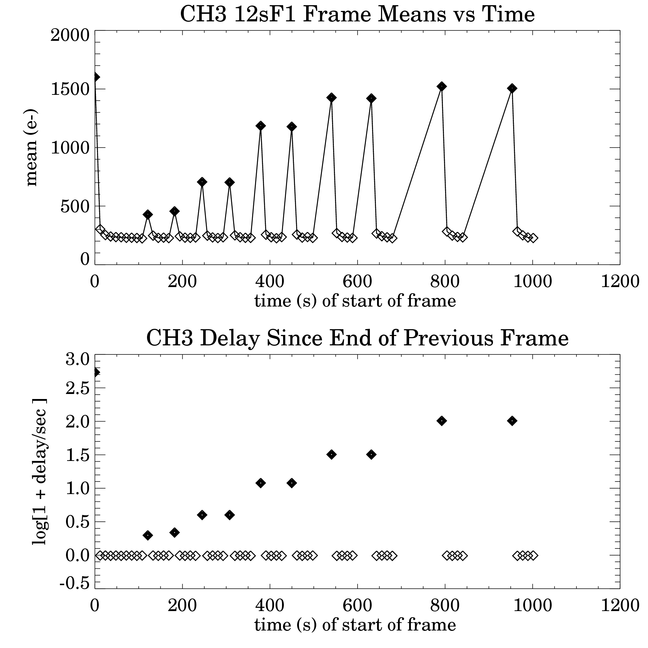
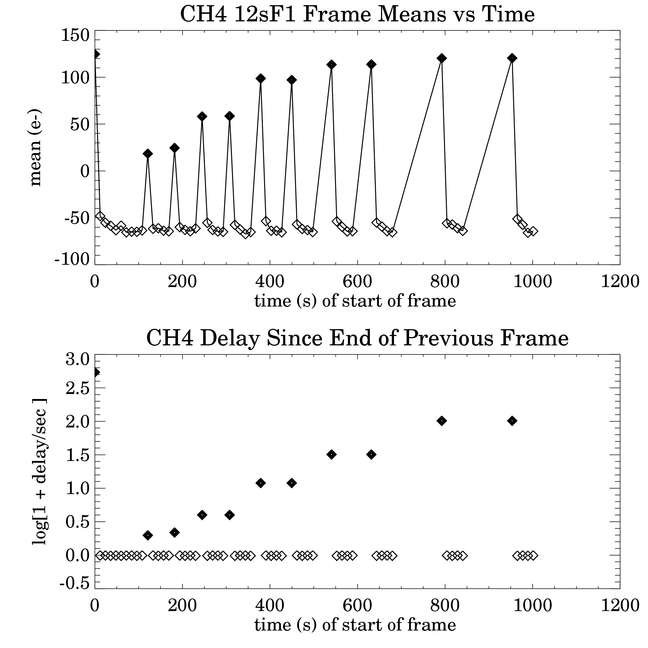
Except in the case of the 2sF4 frames in channel 1, all channels were operated simultaneously in the test. In channel 4, the data were taken under flight-like timing, which means, among other things, that while the other 3 channels were taking one 100sF16 frame, channel 4 recorded two frames of 50sF16. The entire test sequence is broken into single sequences of frames of the same frametime and Fowler number. For each channel and sequence of Fowler frames, there are four plots. The first pair of plots show the mean of each image versus the time of the beginning of the Fowler frame in the upper plot. The lower plot has the same abscissa, but shows the time difference ("delay time") between the beginning of the frame and the end of the previous frame. If the delay time is at least 200 ms, then IRAC would have automatically reset the array in that interval, every 200 ms, until the beginning of the frame. If there is < 200 ms, there would be no extra reset, and the array would have been reset only at the beginning of the Fowler (or pedestal) frame. In all plots except for the pedestal-signal data, first frames in a DOIT are plotted as filled symbols, and the rest are plotted as open symbols.
Since the delay times ranged from slightly negative to about 100 seconds, they are plotted with a convenient scaling,
log10(1 + delay /second).
The delay time for frame n was computed from the ATIMEEND, AWAITPER and AFOWLNUM values in the file headers according to the formula
delay=0.01s*(ATIMEEND(n)-ATIMEEND(n-1))-0.2s*(AWAITPER(n)+2*AFOWLNUM(n)).
As can be seen in the tables linked above, the delay times are slightly less than expected -- as much as 40 ms less (even negative!), depending on the frametime. This error had been noted previously by SAO, and there is (or was) an open PFR on this problem. When a DOIT command is programmed, regardless of the value of NUMREPEATS, the IER inserts a 1.0 s delay before the execution time of the DOIT command, under TTACS control. Thus, the first image in a DOIT will have at least a 1.0 s delay after the previous frame ends, and subsequent images in the same DOIT have zero delay between them -- i.e., there are no extra resets between the images.
The last two rows were excluded from the image means for all the plots in all channels. The last row in every channel detects glow from the source-follower FETs in the mux that are held on during the integration. For sufficiently long integration times, the last row pixels can saturate. In channels 3 and 4 the glow is large even in rows near the last row. The semicircular glow from the output FETs in channels 3 and 4 is not bright enough to saturate. Hot pixels, few in number, were not excluded from the means. Image means were converted from DN to electrons by multiplying by 3.7 in channels 1 and 2, and by 3.8 in channels 3 and 4.
One set of pedestal-signal frames were taken, with all 4 channels operating simultaneously, with 12 sec frametime and 1 pair of Fowler samples. The pedestals are read out first and saved, followed by the signal samples. The purpose of this test was to see whether just the pedestal values were affected, or just the signal samples, or both. It is clear from the plots that both pedestal frames and signal frames are affected by the first frame effect, though the pedestals are more strongly affected. This is consistent with what we have known about the Fowler bias in general -- that for a given frametime, the Fowler bias changes more with lower Fowler number, and its spatial dependence in an image is strongest at Fowler 1. This held true in tests of many InSb arrays at UR, even for different clocking of the arrays. The implication here is that the first pedestal sample -- which is the first time an array gets clocked through all its columns since the last signal sample read in the previous image -- is strongly deviant from the rest of the pedestal samples. Since both ATIMEBEG and ATIMEEND can be incorrect in pedestal-signal images, the timing used in the plots was according to the commanded times in the IER. Pedestal means in DN were subtracted from 32768 to normalize the sign. Then both pedestal and signal means were converted to electrons using the same 3.7 and 3.8 conversion factors. The minima within each data set were subtracted respectively from the pedestal and signal means before plotting, so only the changes of the means within a data set are significant.
At the beginning of the first frame test, 3 images of 100sF16 (6x50sF16 in channel 4) were taken to ensure that there were no latent images from a previous test, and to reduce any possible effect of changes in bias, or clocking, etc., that may have occurred prior to the test. Similarly, at the beginning of each data set, a longer sequence (in a single DOIT with repeats, where possible) was taken so that the signals would reach some sort of asymptotic value at the end, appropriate for the given frametime and Fowler number, and for zero delay between images. This could then be used as a reference by which to compare other images in the data set. Also, it was not known prior to this test whether the acts of commanding a DOIT or changing frametime or Fowler number themselves affected the Fowler bias. In retrospect, they appear to have no direct effect; a DOIT affects the Fowler bias because a 1 second delay is automatically inserted before the command is executed. Other actions, like changing the Fowler number, keeping in mind that the Fowler bias is dependent on the frametime, have an effect because of the induced delay.
Channel 1 was the only IRAC channel tested with a short exposure time. With 2sF4 frames, there is not enough time to read out all 4 channels with either no delay or a short delay between frames; hence, all frames are first frames. The plot of the image means vs time is shown below. In a 2sF4 frame (1.2 s exposure), the predicted minimum background on the sky is 2.3 e-. The Fowler bias ranges from 72 e- to 68 e- as the delay time increases fom 1 s to 100 s, so it is high compared to the background, but the change of only 4 e- is small compared to the pixel noise. Except for the first DOIT, which had 10 repeats, all the images within each DOIT had means that differed by less than 1 electron. The lower plot of the first pair of plots shows how the delays were increased during the sequence of images. The first point is the first (and only) image mean of the first DOIT, which began about 3 s after the end of the previous 100sF16 frame. The second point is the second DOIT, and so on. The timing was commanded with explicit delays of 0, 2, 4, 10, 30, and 100 s between images; the actual delays were about 1 s longer because of the DOIT command. When the delay time between frames changed, either implicitly, or by command, there was an extra 0.2 s (one clock tick) delay in the start of the frame.
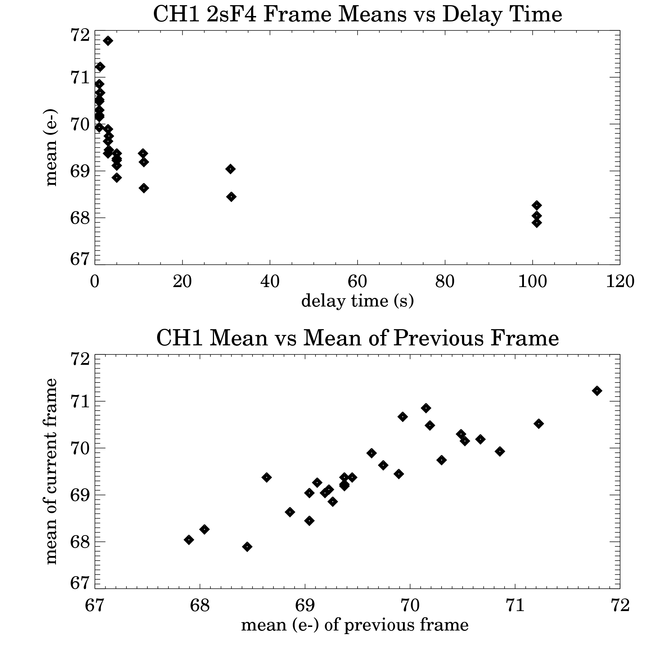
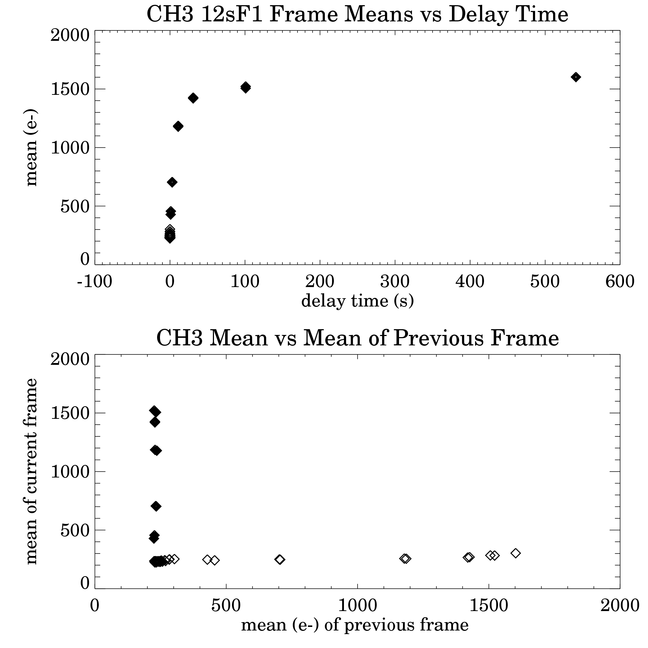
The second pair of plots show the frame means versus delay time and the frame means versus the mean of the previous frame. In the latter case, the first frame in the set is ignored. These plots show the relative dependence of the frame means on either the delay time or the previous image. In this case, the Fowler bias is clearly dependent on both: it decreases as the delay time increases, and it increases linearly with the mean of the previous frame, with about 1 e- of scatter. The dependence is simple, because there is only one image per DOIT, and unlike the other sets of Fowler frames, there are not delays followed by groups of images with no delay between them.
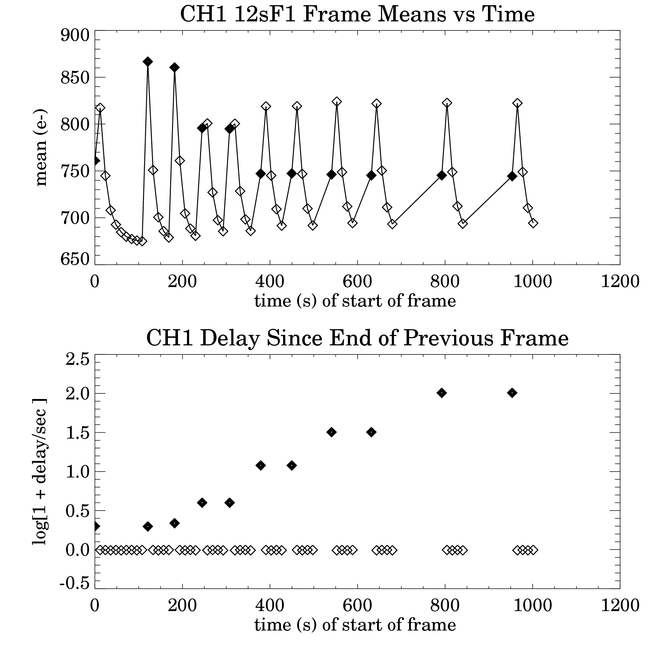
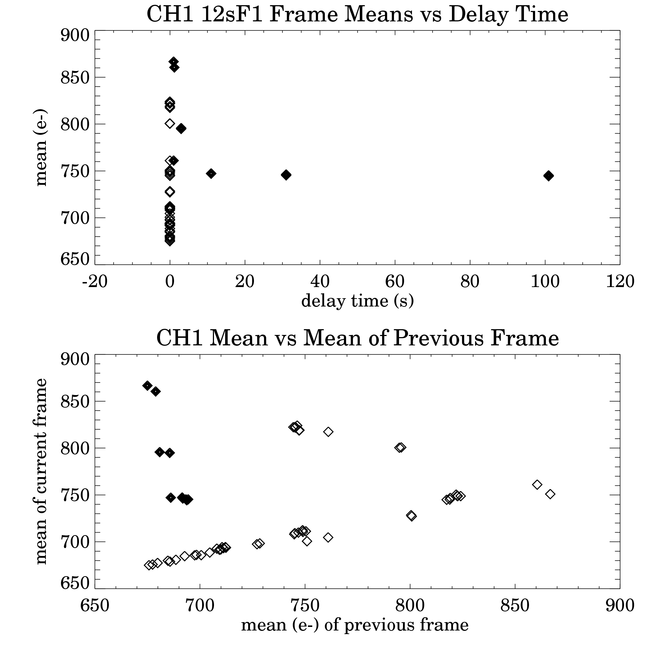
The 12sF1 image means are shown in the third and fourth sets of plots. For this frametime and Fowler number, as in the succeeding plots of Fowler frames, the minimum delay between frames was zero. In this case the Fowler bias in the first frames decreases as delay time increases, and it decreases in the first and second frames as the mean of the previous frame increases. The trends are distinct in the plots of means versus delay time and mean versus mean of the previous frame. The first frame means drop quickly with short delay times, but with delays of 10 s or more, they are almost independent of delay time. In the lower plot, the arrangement of points looks like the upper part of a H-R diagram. The first frames look like the main sequence, the second frames, which include the two rightmost points, look like the horizontal branch, and the rest of the frames look like a RGB. The last group, which includes the third and later images in each DOIT, is linear in its dependence. The two dependences conspire to make the second frames larger than the first frames for delay times of 3 s and longer.
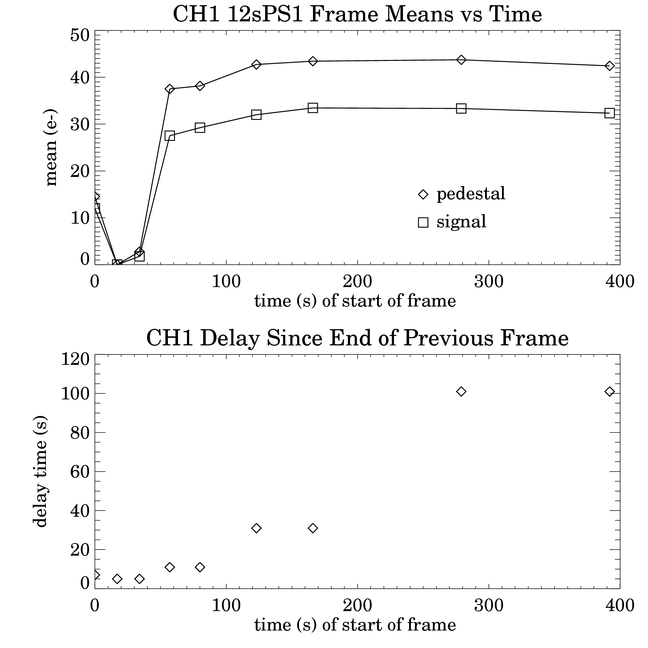
The fifth set of plots is for the 12sPS1 data set -- 12 s frametime in pedestal-signal mode with one Fowler sample pair. Within each image the timing is the same as the 12sF1 images. Because of the time needed to transfer two image buffers instead of one, DOITs can have no repeats. The minimum delay time was 5 s. Because of the errors in ATIMEEND, the delay times were computed from the scheduled execution times in the IER. From first to last frame they are in seconds: 7.0, 5.0, 5.0, 11.0, 11.0, 31.0, 31.0, 101.0, 101.0. The actual times may differ by a few ticks of the 0.2 s clock. All images were first frames in a DOIT so they should be compared with the first frames (filled diamonds) in the previous plots. Compare the points with the 5 s delay in PS mode to the 3 s delays in the Fowler mode, and the 11 s delay points in the PS mode with the 11 s delay points in the Fowler mode, and so on. The greatest change in pedestal and signal means was about 10 e-. It occurred between the images taken after the 5 s and 11 s delays. The pedestal increased more than the signal, accounting for the decrease in Fowler bias. The change in the Fowler mean from the 3 s delay to the 11 s delay was about 50 e-, which is quite a bit more than the change in the Fowler mean. However, the Fowler bias decreases rapidly with delay time from 1 s to 3 s, so the results are not inconsistent. For delays longer than 11 s the pedestals and signals change by the same amount. These results are consistent with the Fowler bias being nearly independent of delay time for delays longer than 11 s.
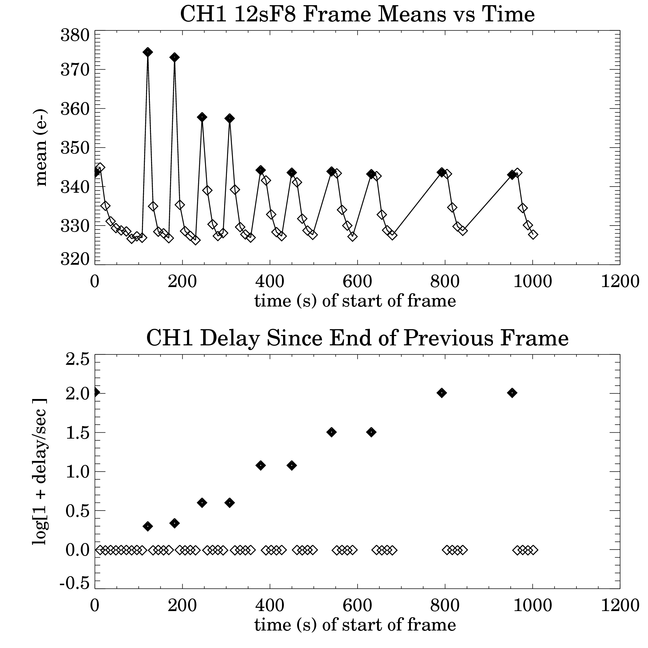
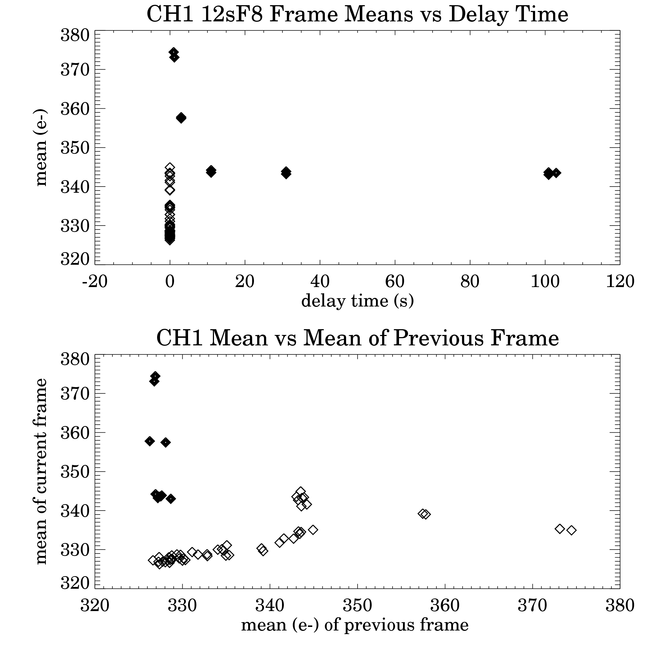
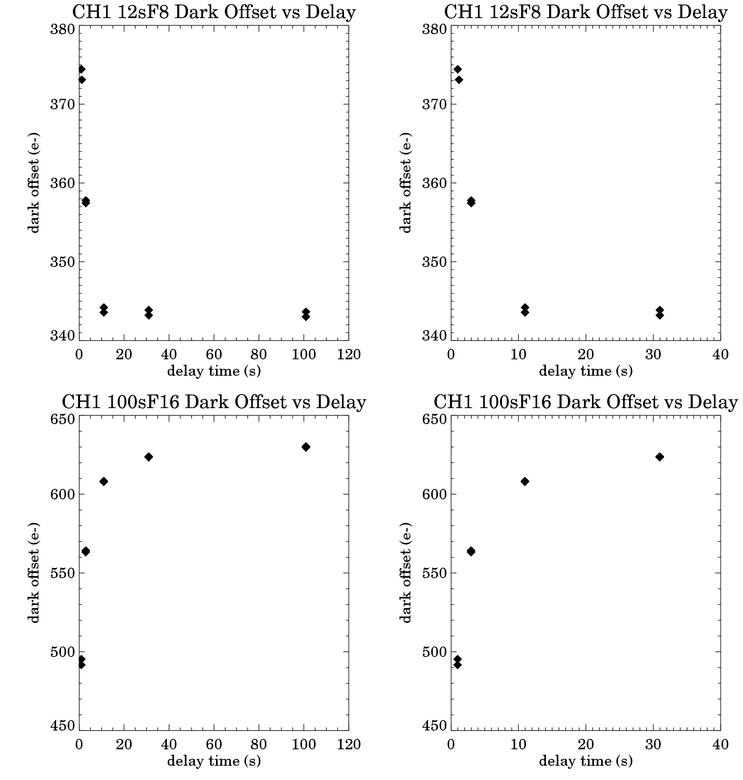
The sixth and seventh sets of plots are of the 12sF8 means. This is one of the standard frametime/Fowler number combinations for observing. The timing between frames is identical to the 12sF1 data set, so they can be compared directly. The trends in the means are similar to the 12sF1 means, but the overall Fowler bias is reduced by a factor of two, from about 750 e- to 350 e-, and the range of Fowler biases is reduced by a factor of four, from 200 e- to 50 e-. The first frames still decrease with increasing delay, and the second frames still increase, but they don't overtake the first frames. The "H-R" diagram of mean versus previous mean is very similar.
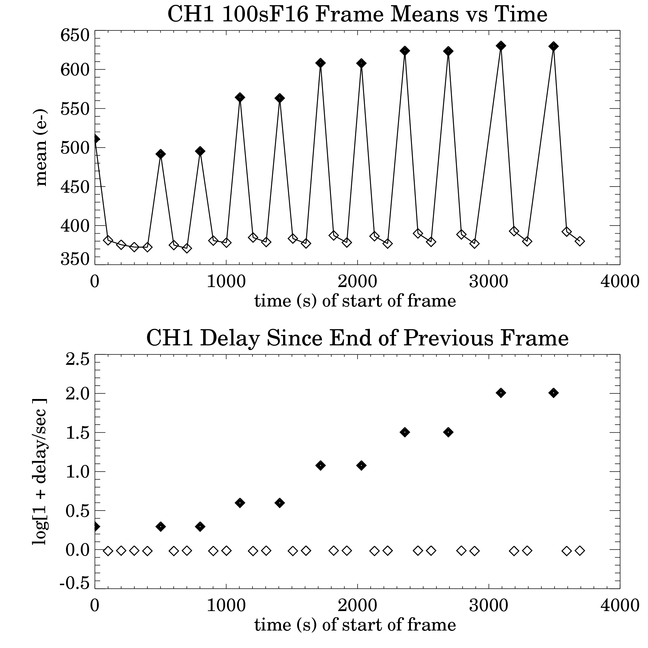
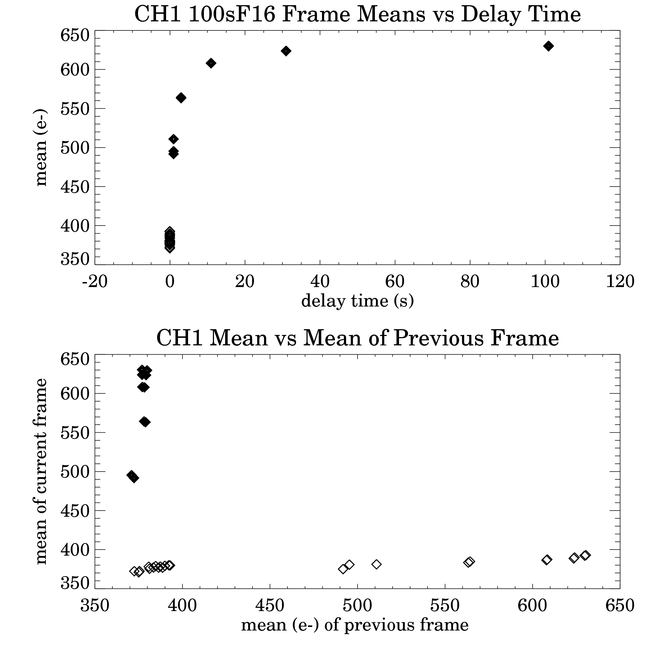
The trend is different in 100sF16 frames, as shown in the eighth and ninth sets of plots. This is also one of the standard frametime/Fowler number combinations for observing. In this case the first frame in a set with NUMREPEATS=3 increases with delay time. The second frame increases, too, but at a much lower level. The Fowler bias in the first frame increases rapidly with delay time, but nearly levels off between the 31 s delay and the 101 s delays. The second and subsequent frames in a DOIT fall on a line, the "RGB", in the mean versus previous mean plot, as did the third and subsequent frames of the 12sF8 images. The overall change of the means with delay time, about 270 e-, is larger than the predicted minimum background, which is 184 e-.
The first point in the set -- the first frame after the frametime and Fowler number were changed
from 12sF8 to 100sF16 -- is 15 e- higher than the two subsequent first frames. This is anomalous,
considering how well means repeat within the test. The slope of the mean versus previous mean plot is
5.3% for the non-first frame points. Given the mean of the last frame of the 12sF8 set, 327 e-, and
the means of the frames preceding the first frames in the 100sF16 set that follow 1 s delays, one
would expect the first point to be only 2 e- lower, not 15 e-. So something else is going on here.
One thing this entire test does not do very well at all is to measure the effect of the mean of the
previous frame on a first frame. The slopes are derived from means of non-first frames and they
apparently don't apply to first frames.
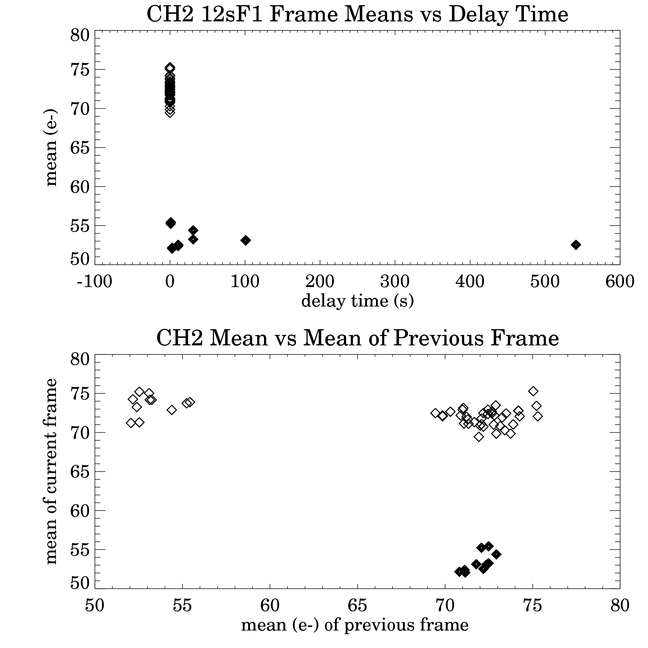
Channel 2 has the smallest Fowler bias and the smallest first frame effect. In the 12s frames, the first frame after a delay has a lower bias than the rest. The first data point in the set has a delay time of 541 s. The previous set of frames was taken in channel 1 only, with "NOT4NOT3NOT2GO1" in the DOIT command, so channels 2-4 were in the automatic reset mode from the end of the third 100sF16 image taken near the beginning of the test. The means of this first frame after the long delay, and the repeat frames following it, are close to the same values in the cases of the 101 s delay. The points in the mean versus previous mean plot fall into 3 clumps -- one clump with only first frames, one with only second frames, and a larger clump all the rest.
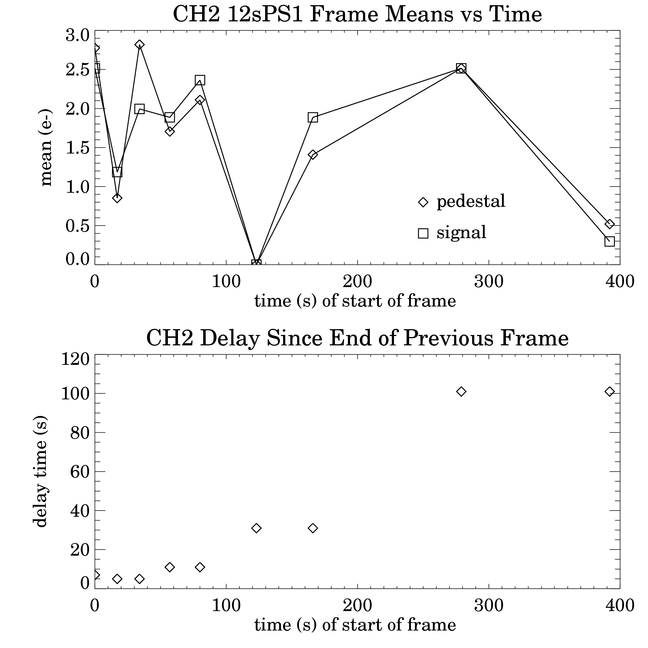
The pedestal-signal means in channel 2 show no particular trend. All the means lie withing a remarkably narrow range of 3 electrons. The dispersion is even smaller in the difference, signal minus pedestal. The mean signal minus pedestal is 52.5 e-, and the dispersion about it (excluding the point where both signal and pedestal have their minima) is about 0.5 e- rms, or 0.135 DN.
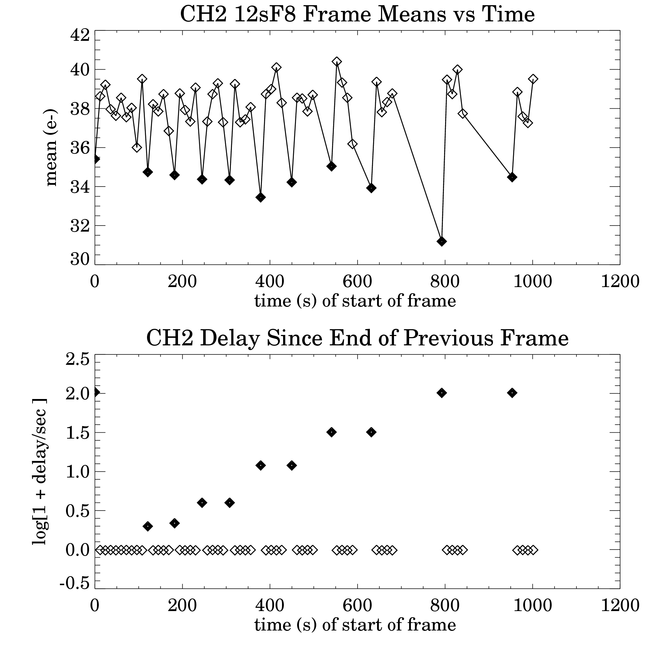
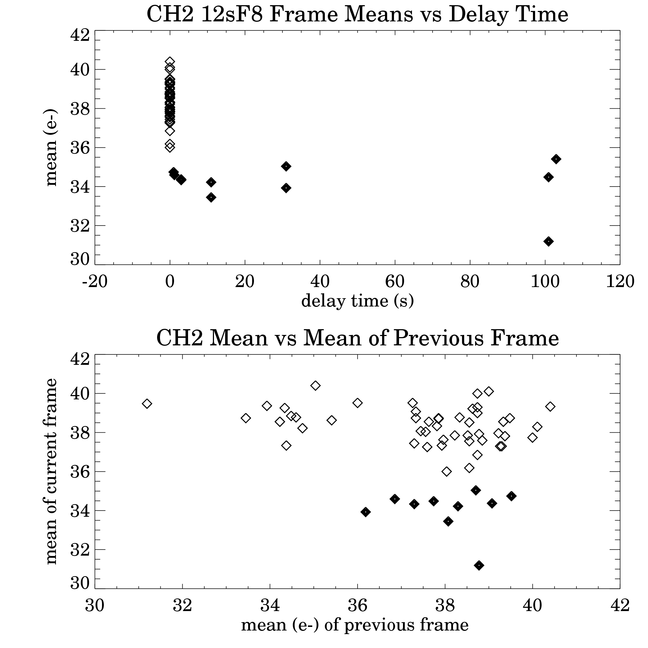
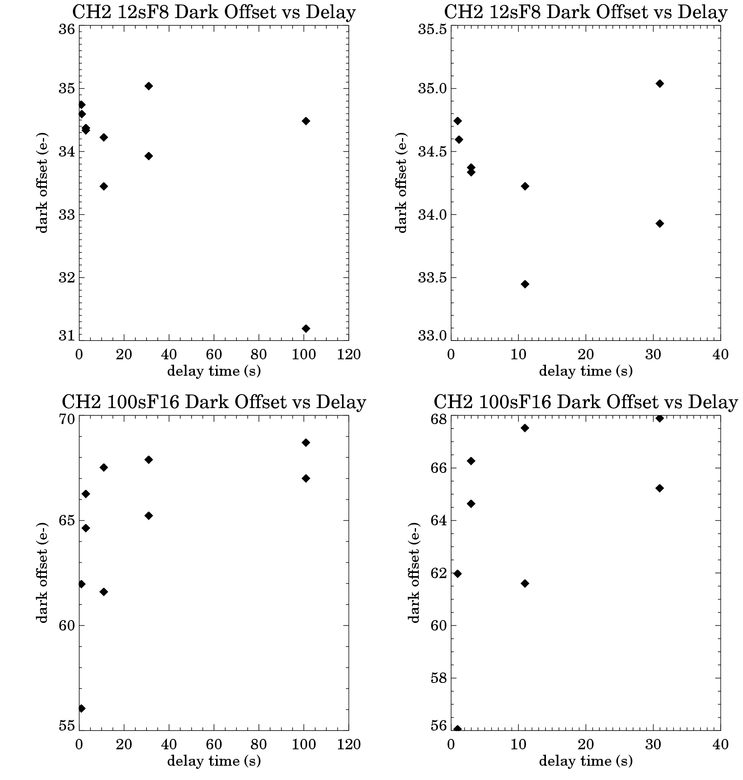
The first frames in the 12sF8 set have a lower Fowler bias than the rest, though the difference is smaller than in the 12sF1 set. The Fowler biases are 50 - 70% of the 12sF1 biases. There is somewhat more dispersion in means within the group of first frames and the group of non-first frames. There is no really significant trend in the first frame means versus delay time. Like the 12sF1 means, the data fall into 3 trendless clumps in the mean versus previous mean plot.
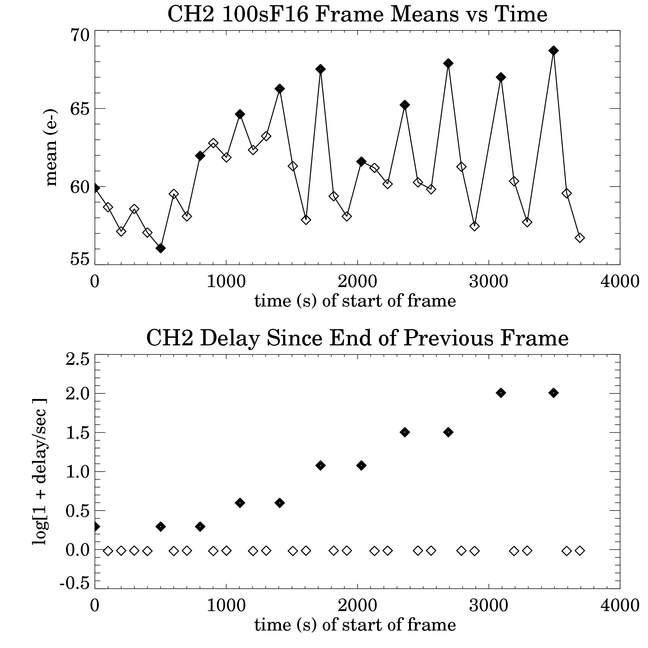
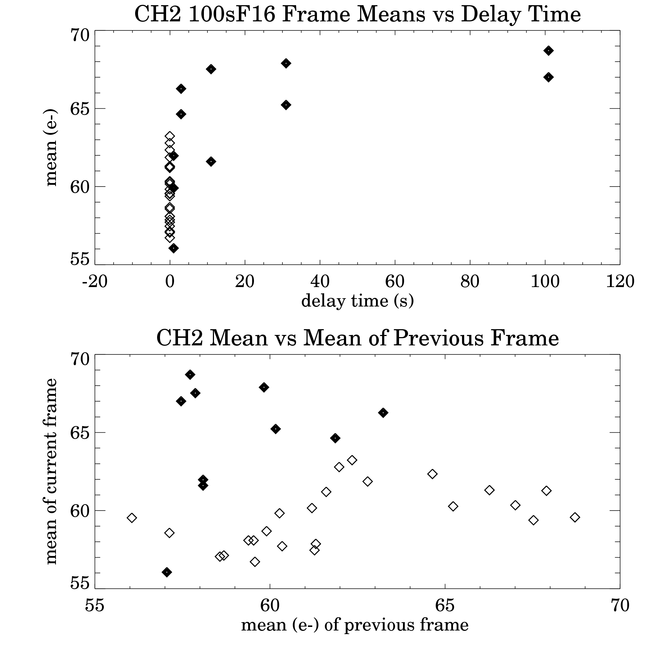
In the 100sF16 frames, the first frames tend to increase with delay time up to about 10 s. The overall range is 13 e-.
The first frame in the second set after a 30 s delay appears to be an outlier. It's about 5 e- lower than
expected, which is about a 5-sigma deviation. There is no obvious anomaly in the first point of the set, unlike the
other 3 channels.
Channel 3 has by far the strongest first frame effect, but it is very consistent. In 12sF1 frames, the difference of the Fowler bias in the first frame from the "asymptotic" value increases from about 200 e- after a 1 s delay to 1300 e- after a 100 s delay. The deviation of first frames from subsequent frames is much more pronounced in the IBC arrays than in the InSb. In relative terms, the dependence on mean of the previous frame is far weaker than on the delay time. The slope of the line connecting the non-first frame points in the mean versus previous mean plot is 3.5%. The first frames are follow a smooth curve with delay time, rapidly increasing up to 30 s delays, then slowly up to 541 s.
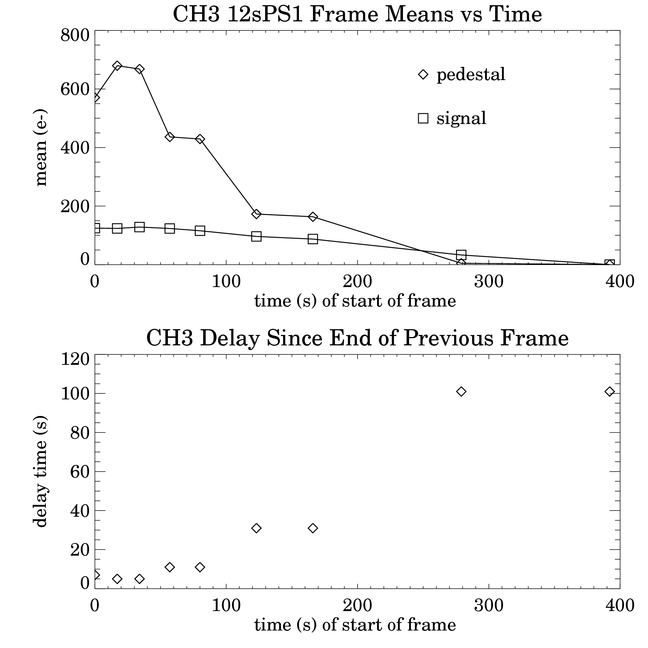
The 12s pedestal-signal frames are shown above. The pedestals show a stronger dependence on the delay time than do the signals, and both decrease with increasing delay time.
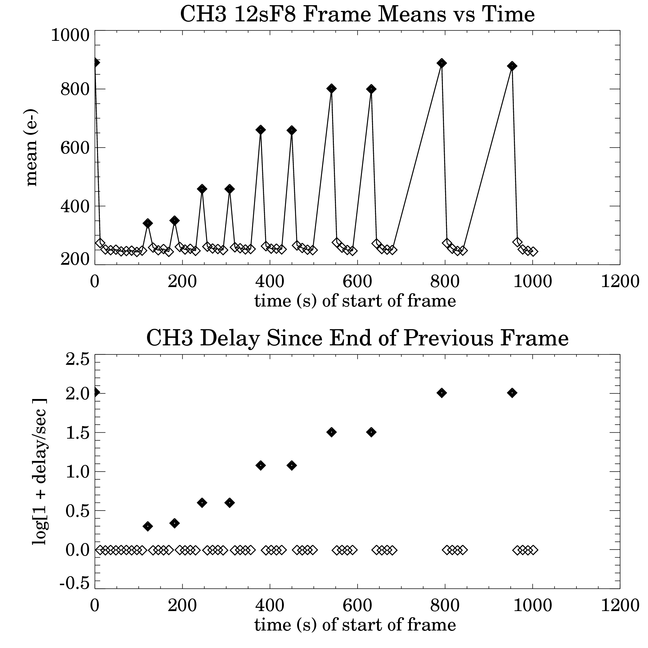
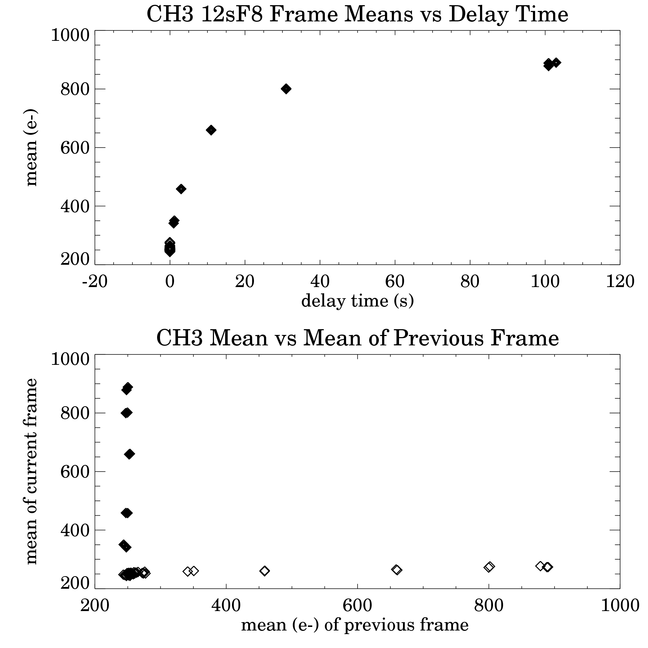
The 12sF8 means show the same pattern as the the 12sF1 frames, but with a smaller amplitude. The overall change is about 650 e-. The trend in the first frames with increasing delay time follows a smooth curve up to 101 s. On the scale of the plot, most points at the same delay time are indistinguishable. The slope of the non-first frames in the plot of means versus previous means is 3.8%, which is consistent with the 12sF1 slope.
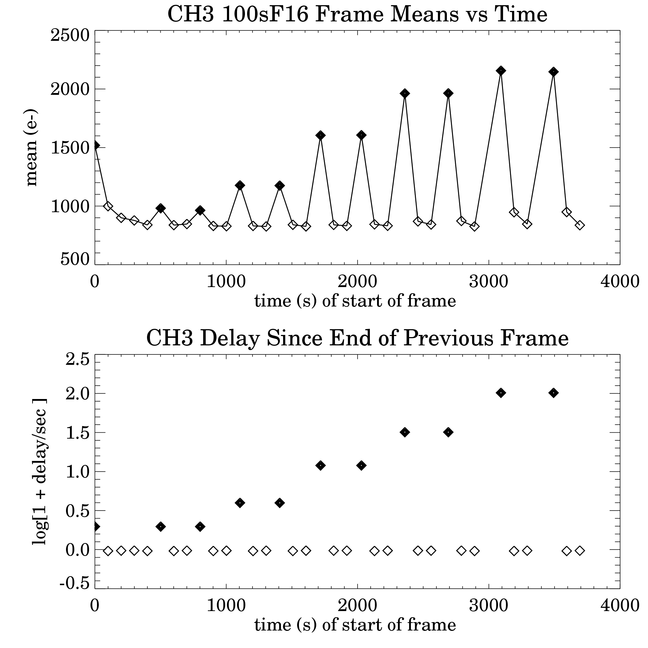
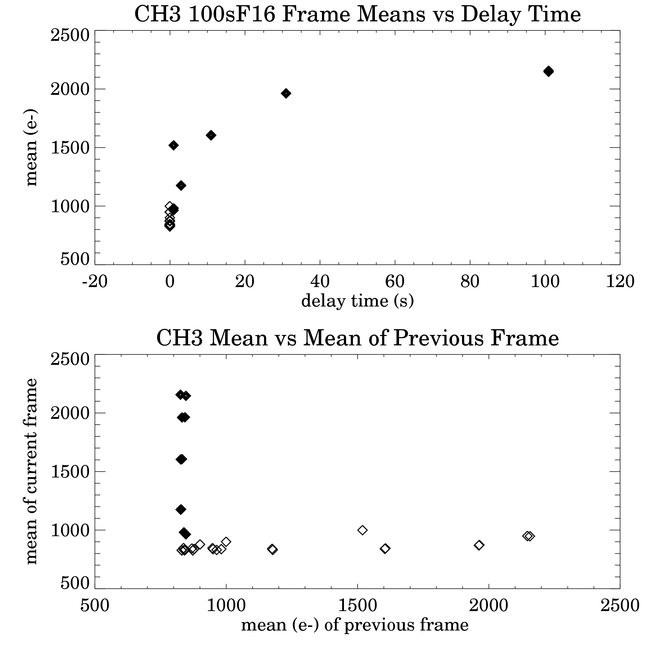
The 100sF16 means are also similar, and the difference of the first frame from the asymptote increases from 170 e- to 1340 e-. The first data point and the few following it are very deviant from the rest. The delay time was only 1 s, but the mean of the previous frame was 190 e-. The first point is about 1500 e-, while the next two first frames, also taken after 1 s delays, are about 980 e-. The last frame of the previous data set was 250 e-. Assuming the effect on the first frame is 4% of the previous frame, one would expect the first frame to be 25 e- lower, instead of 1170 e- higher.
The 12s frames in channel 4 are similar to channel 3, but at a much smaller scale. In the 12sF1 frames, the first frames follow a smooth curve increasing with delay time, with repeated points indistinguishable on the plot. The overall change is 200 e-. The non-first frames have a weak positive slope in the dependence on the mean of the previous frame.
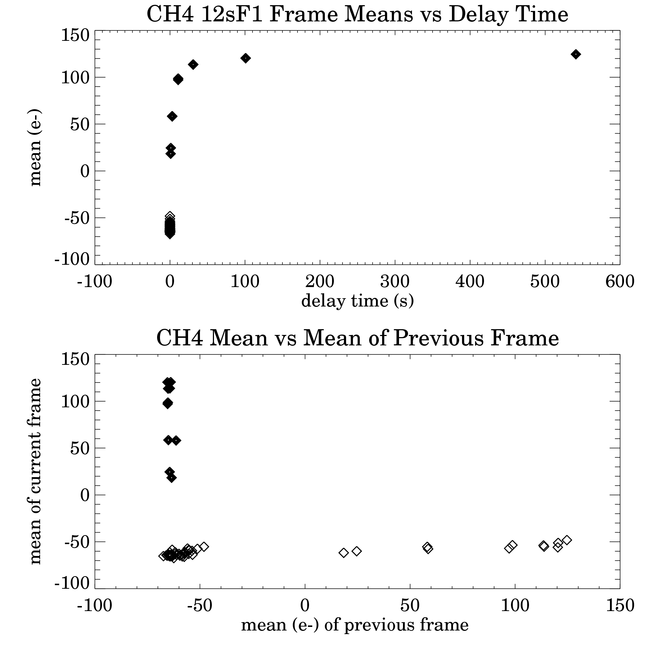
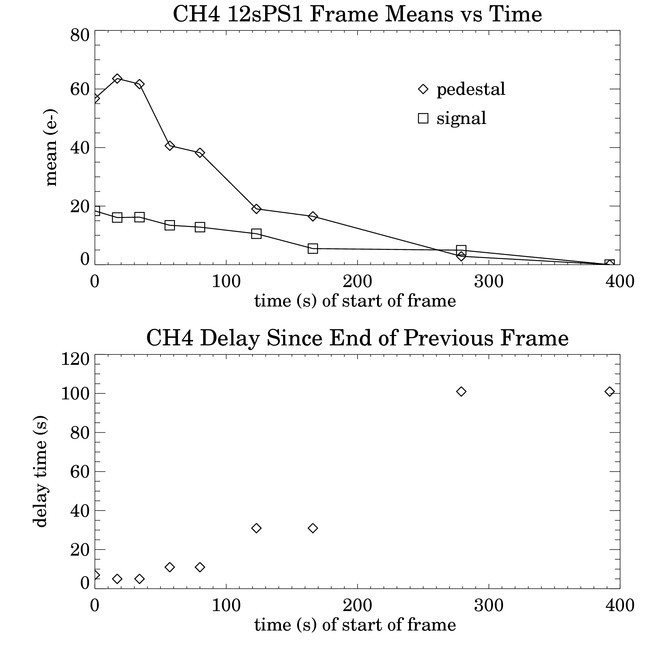
The plot of the pedestal and signal means for the 12sPS1 set are shown above. The plot is nearly identical to the channel 3 plot, except that the vertical scale is 10 times smaller.
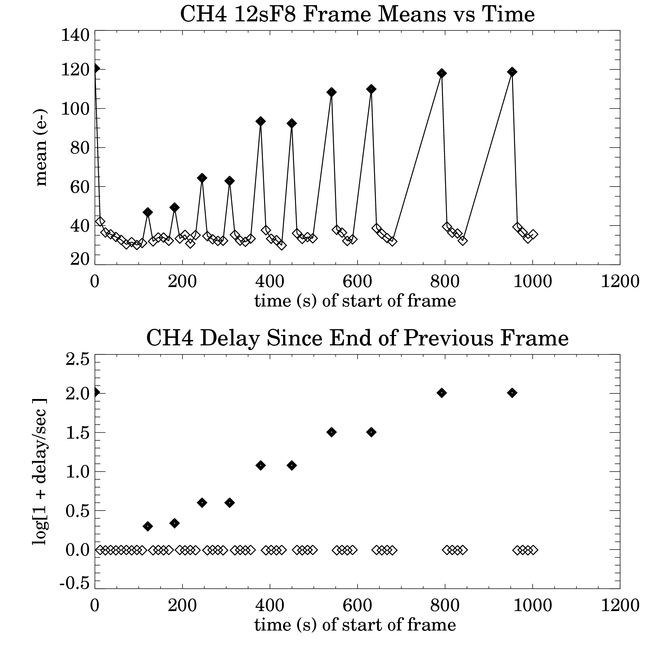
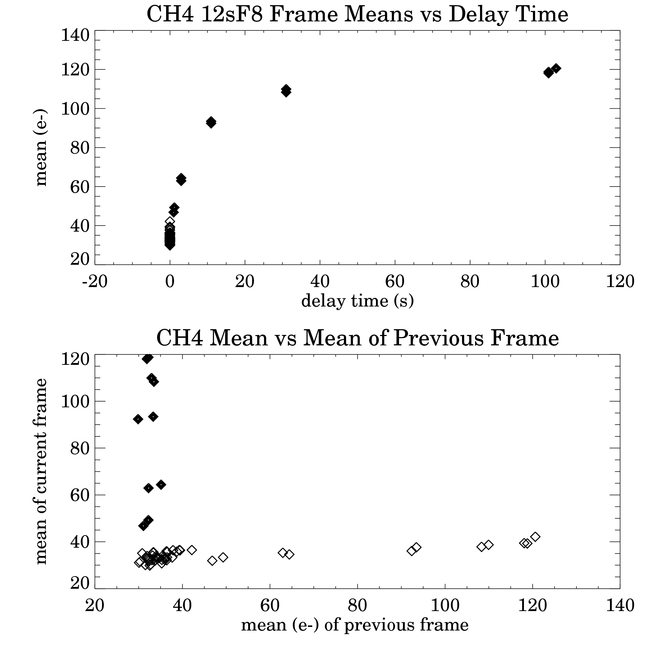
The 12sF8 data are plotted above. They are very similar to the 12sF1 results, except that the overall change is 90 e- instead of 200 e-. The random errors in the means are about 3 e- rms.
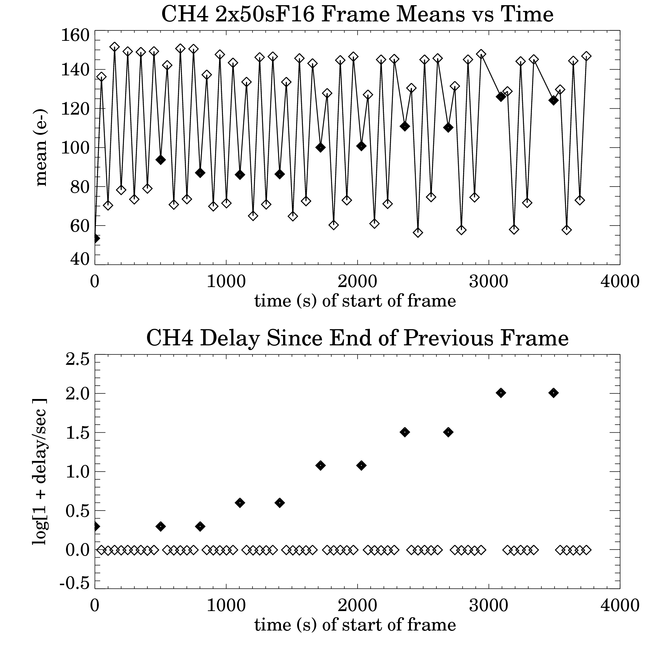
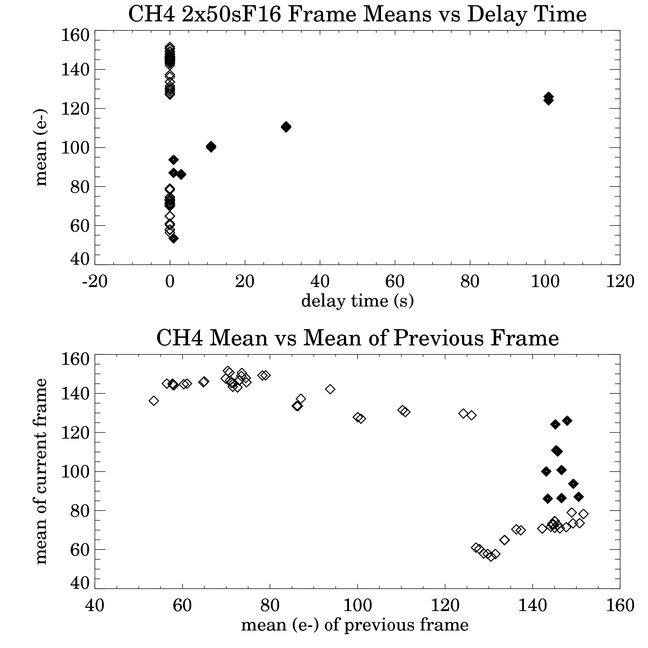
The set of 2x50sF16 frames was taken concurrently with 100sF16 frames in the other channels. In channel 4, in flight-like operation, two 50s frames are taken in the same interval when a single 100s frame is taken in the other channels. The pedestal reads occur at the same time (within small clock variations -- the 4 arrays are clocked asynchronously) in the first 50s frame as the pedestal reads in the other channels, and in the second 50s frame, the signal reads occur at the same time as in the other channels. The first frame behaves in the typical manner in the Si:As arrays, increasing in Fowler bias with the length of the delay time. The third and fifth frames in each set of 6 have a lower Fowler bias, as usual, although the fifth frame is somewhat higher than the third. The second, fourth, and sixth frames, whose pedestals are read at times when the other channels are not read out, have higher Fowler biases than the others, and the range is compressed. This effect on the bias may be due to crosstalk -- there may be more currents on the ground lines when the arrays are being read out, and any voltage change in the ground would be reflected with an opposite sign in the 1st, 3rd, and 5th frames, compared to the 2nd, 4th, and 6th frames. Comparing 3rd frames to 3rd frames, and 4th frames to 4th frames, and so on, it appears that the stability is about 2 e- rms.
Like in channel 3, the first and second frames in the 100sF16 test are anomalous. The bias in the first frame, 53 e-, is about 37 e- lower than the means of the other first frames that follow 1 s delays. The mean of the last frame in the previous data set is 35 e-; the corresponding previous frame means for the other 1-s-delay first frames are both 150 e-. This probably cannot account for the low value of the first data point, but it is not at all clear, because of the complication of having the odd- and even-numbered frames.
In general, most of the "first frame" effect is due to the length of time spent in the continuous reset mode before a frame is begun. There are at least two or three other contributions. One is evident in the first several frames of a set (a particular frame time and Fowler number), where the first frame may have some discrepant value due to having followed a delay and a previous set at another frame time. Following this first frame, there is often a slower decay to an asymptotic value than in subsequent DOITs at the same frame time. The other contribution is evident in the channel 4 2x50sF16 frames, where even and odd frames have different -- even opposite -- trends. It indicates there is crosstalk, perhaps on ground lines, from other channels having their pedestal or signal samples taken at the same time. There is a weak dependence of a non-first frame on the mean of the previous frame, though it is not clear whether this is strictly due to the previous frame, or is just a long-lasting effect of the continuous resets.
Is the delay effect thermal? I don't think so. The arrays are controlled to a mK, so there would have to be gradients built up between the arrays and the Cernox resistors. Certainly the power dissipation in an array is affected by the timing: when the last row and column are held on after a long integration, because of the glow in the last row of every array, the average power dissipation in the output FETs of the mux will differ from that during periods between frames where the arrays are reset every 200 ms and the outputs stay near the pedestal levels. One possibility is that there is a slow recovery time in the mux when all columns undergo a large change in voltage.
One way to test if the effect is thermal is to turn off the heater control and use a constant heater voltage. Another proposed test is to compare the voltages in the signal frames of the previous frame to the Fowler bias in the current frame to see if there is a strong correlation. Another test that should be done is to do a systematic test of the effect of change of frame time on the first frame effect. It appears from the results that there may be no direct effect of changing the frame time, except through the possible effect of the previous signal value on the first frame. Certainly more testing has to be done at the important frame times and Fowler numbers, and for longer delay times that will occur in flight.
Since the glows from the last row FETs cause latents, it may be possible that some of the details of the first frame effect in channels 3 and 4 are contaminated by latents in the image means, because only the last two rows were excluded from the means. Another possibility I have not looked into, but which could be examined in these data, is whether the effect of the previous image is really due to the image mean, or whether it depends on something else, like the value of the last row.
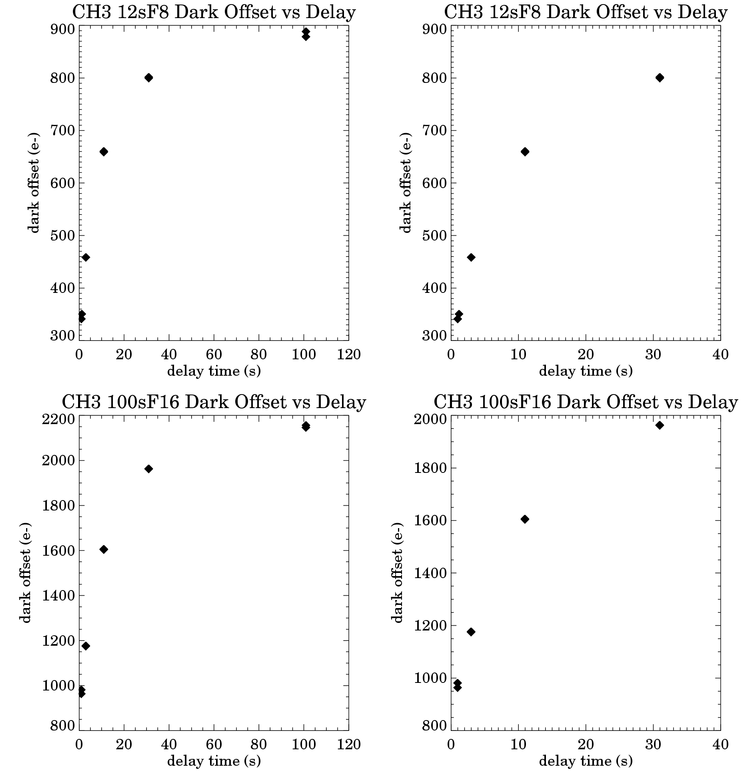
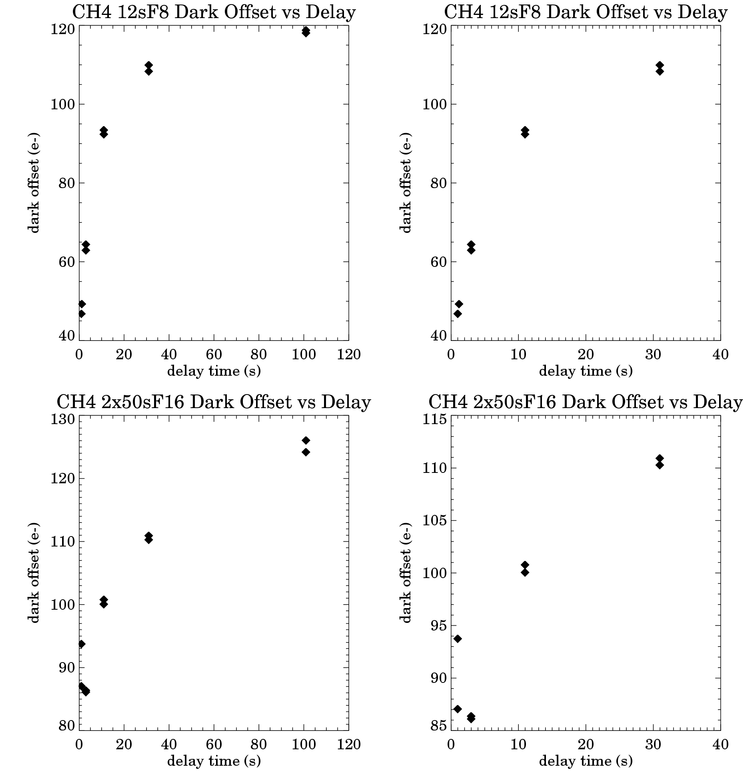
Summary plots of the first frame dark offsets are shown below.
Last update: 2001 July 2, by Bill Glaccum